Create a synthetic test chart from several individual image files
Composite Chart can be used for two essential purposes.
- You may want to analyze colors in a microscopic image that has a field too small to capture an entire test chart (for example, a replica of the X-Rite Colorchecker, which is available in 35mm film size (24x36mm).
- You may want to combine several images to obtain tonal response and noise, following recommendations in certain ISO standards.
To run Composite Chart, click the Utility dropdown menu (in the Imatest main window) and select Composite Chart. The following window opens.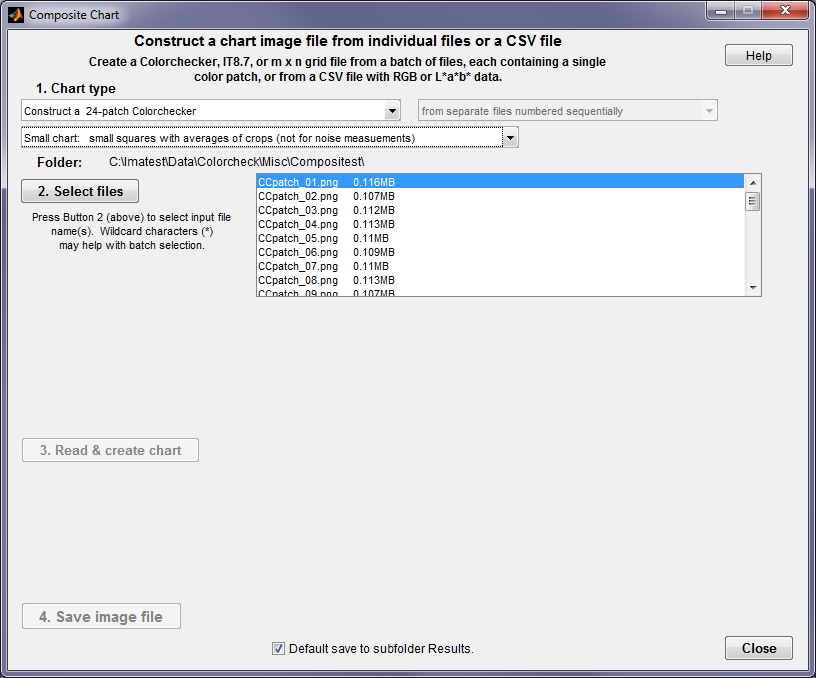
Composite Chart start window
First, select the chart type.
Options for chart types are
- Construct a 24-patch Colorchecker.
- Construct an IT8.7 (rows A-L, columns 1-19: 228 patches). The first two were requested by a customer with a microscopic system where the field of view was too small to capture the entire chart. The IT8.7 has too many patches to be practical.
- Construct a 1xN linear step chart. This combines several images for certain ISO standard calculations.
- Construct a 4x12 grid chart. This was a special customer request. We can easily add additional charts on request.
The second dropdown menu has two selections:
- Small chart: small squares with averages of crops (not for noise measurements) This is a good choice when colors and tones are to be analyzed (but not noise). patches are always square.
- Large chart: Use full crops (good for noise measurements, except for IT8.7) Patches maintain the aspect ratio of the crop (below, after images are read).
Second, press to choose the files to combine. The order will be based on a sort of the file name: we recommend that the names contain a numeric sequence. Use the usual techniques (shift-click, control-click; wildcard characters if needed) for selecting multiple files.
Third, click . The chart will be displayed.
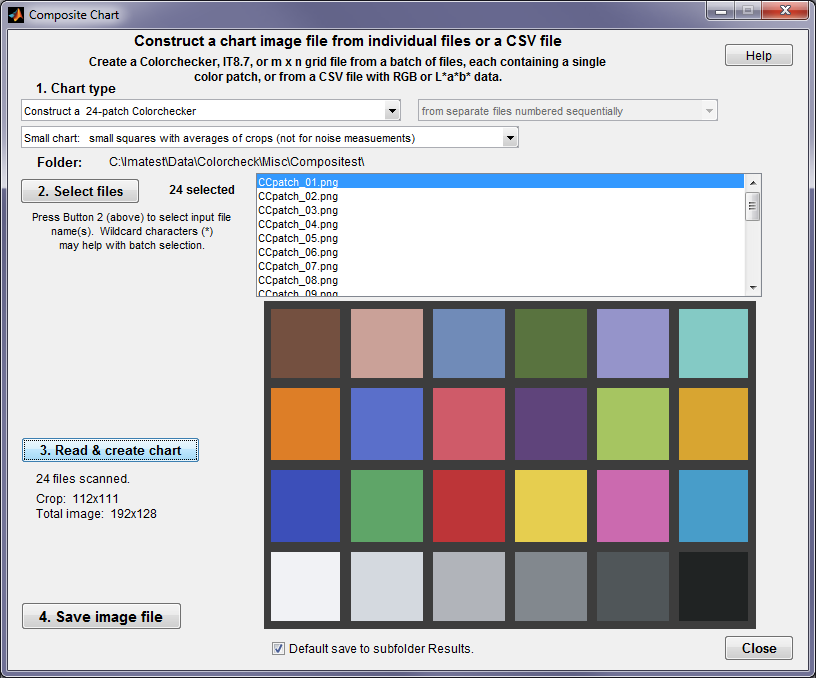 Composite chart window, showing the synthetic chart
If the chart image looks correct, click , and follow instructions.