Since SFRplus (and eventually eSFR ISO, which uses almost all the same settings) is included in IT EXE and DLL, users may sometimes need to examine or edit the INI file used to control IT versions.
Most of the settings in the [sfrplus] or [esfriso] section are set by one of the three SFRplus or eSFR ISO Settings windows that can be opened when SFRplus is run in Rescharts (or by clicking SFRplus setup in the Imatest main window). A few are set by responses to other windows or user actions. Settings that affect only Rescharts mode (and hence do not affect SFRplus Auto or the IT versions) will be highlighted in pink.
When Rescharts SFRplus is opened, typically by pressing SFRplus setup, the main SFRplus settings window is opened.
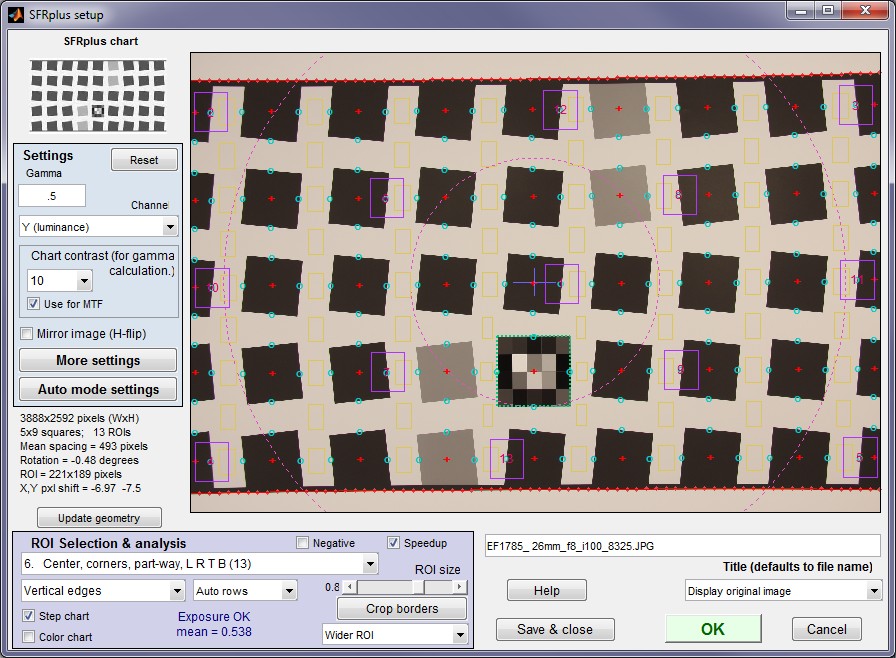
SFRplus settings window (also ♠ in table)
Two additional windows can be called from the SFRplus settings window. You can toggle between them or return to the settings window.
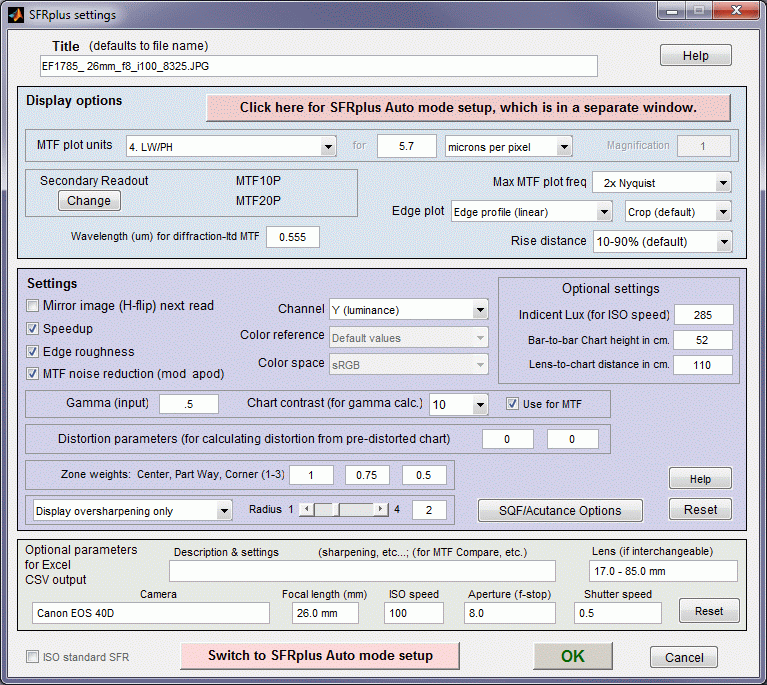 SFRplus More settings window (also ♠ in table)

SFRplus Auto mode settings window (♦ in table). Settings in this window
only affect SFRplus Auto (or IT EXE/DLL) runs. They do not affect Rescharts (interactive) runs.
INI file settings that affect several modules are described in Imatest INI Reference.
| (-IT) | Not used in Imatest IT |
| (gr) | Affects graphics (figures). May not be of interest for Imatest IT, where graphics is often suppressed (by setting disable_figs = 1 in the [api] section). |
| (index) | Setting is equal to the index of the popup menu. You'll need to open the Settings window to see these: rarely for important IT settings. |
| (index-1) | Setting is equal to the index of the popup menu - 1 (0 - (index-1)). Keeps backwards compatibility for some settings that were originally 0 (off) or 1 (on), but had options added. |
| ♠ | SFRplus Settings or More Settings window |
| ♦ | Auto mode settings window |
| ρ | Set during read |
| σ | Set during save |
| ◊ | Set in other window |
Table of [sfrplus] settings
| Parameter | Settings window ♠ SFRplus settings or More settings; ◊ Other; ♦ Auto mode ρ Read; σ Save | Typical values (default if in [brackets]) | Description | Notes |
| anlz_rough | ♠ Analyze roughness | 0 or 1 [0] | Analyze edge roughness if 1; leave at 0 for speed if not needed. | |
| anlz_sqf | ||||
| aper | ♠ Aperture (f-number) | (real number) | Normally from EXIF data. May be manually entered in More settings for ISO speed calculation. | |
| areanorm | ♠ Area display normalization | [2 2] | See Secondary Readout settings. | |
| autoreload | ◊ Auto Reload (check) settings in Rescharts Settings dropdown menu | 0 or 1 [0] | 1 enables automatic (repeating) reload in the Image Sensor edition. | (-IT) |
| bayeraw | ◊ (Set by several buttons in the Monochrome image settings window) | 0-5 [0] | If > 0, monochrome files contains Bayer RAW data. 1-4, indicates primary color to analyze (R, Gr, B, Gb). 5 indicates Demosaic. | |
| CA | ♦ Plot Chromatic Aberration (checkbox) | Min or Max [Min] | Plot Chromatic Aberration | (gr) |
| camera | Camera type | (text) | Normally obtained from EXIF data. Does not need to be populated. | |
| chartht | ♠ Chart height (bar-to-bar) in cm. | >0 [0] | Used in Field of View (FoV) calculation | |
| chcontrast | ♠ Chart contrast index & use | [1 0 0] | Element 1: Chart contrast index. 7 for contrast=10; 9 for contrast = 4, etc. 2: Chart contrast. 3: 0 or 1. If 1, use chart contrast to determine gamma for MTF calculation. | |
| closefigs | Set by the Close figures after save checkbox in the Save window. | 0 or 1 [0] | 1 recommended for IT (closes windows after save). | |
| colorchart | ♠ Analyze color chart | 0 or 1 [0] | Set in SFRplus settings window | |
| colorspace | ♠ Color space | sRGB | Color Space name. Used in color chart analysis. | |
| crop_borders | (NOT RECOMMENDED) Extra cropping beyond the coarse & find adjustments. Set in the Crop pixels near borders section (lower-left). | 0 0 0 0 0 | First value turns extra cropping off/on (0/1). 2-5 are for L R T B in pixels. (NOT RECOMMENDED) | |
| csvbase_header | Lines in header of CSV database file | 1 or 2 [2] (index) | ||
| csvs | CSV output file options | 1-3 [1] (index) | 1 = Separate CSV files for individual ROIs. 2 = Save summary CSV file only. 3 = Combine ROIs into one large CSV file. | |
| cyclesper | Plot Edge and MTF | Min or Max | Used in SFR. Replaced by edgeMTF in SFRplus. | (gr) |
| cyclesper_value | Index for Edge/MTF plot units | 1-9 [1] (index) | 1. Cycles/pixel, 2. Cycles/mm, 3. Cycles/inch, 4. LW/PH, 5. LP/PH, 6. Cycles/milliradian, 7. Cycles/degree, 8. Cycles/Object mm, 9. Cycles/Object in | |
| dbase_plots | (For Future database edition; unused in Master of IT) | |||
| disp3d | Display format for 3D plots | 1-6 [2] (index) | 1. Pseudocolor, image & text; 2. Pseudocolor shaded, image & text; 3. Contours, image & text; 4. Pseudocolor only; 5. Pseudocolor shaded-only; 6. Contours-only | (gr) |
| distort_params | Distortion parameters for pre-distorted chart | [0 0] | Parameters for pre-distorted charts. If non-zero, the correct distortion and Field of View is calculated (chart distortion is compensated). | |
| edgeIDfile | Edge ID file | '' (empty) | File for specifying Edge IS. Used only for roisel = 15 or 16. Instructions here (Scroll down to Region selection). | |
| edgeMTF | ♦ Plot Edge and MTF | Min or Max [Max] | Edge and MTF plot | (gr) |
| figsave | ♦ Store images in PNG or FIG format. | 1 or 2 [1 (PNG) recommended] | File type for saving figures (PNG or FIG). FIG not recommended because it requires much more storage. | (gr) |
| filecomb | Set when multiple files are selected for analysis | 0 or 1 [0] | 0: Read and analyze files as a batch, 1: Combine files (signal-average) | (-IT) |
| foclth | Lens focal length in mm | (string) | Lens focal length (usually from EXIF) | (-IT) |
| folder | Set during image file read | (Path name) | Folder for last input image | (-IT) |
| fovcalc | ♠ | 0-4 [4] | Distortion calculation, used for Field of View extrapolation. 1: 3rd order; 2: 5th order; 3: arctan/tan; 4. Best of 1-3 (most accurate, but slower) | |
| gamma | ♠ Gamma (input) (Settings area) | [0.5] | Used to linearize image. Initial setting. | |
| imageo | ♦ Image & geometry plot | Min or Max | Plot Image and Geometry. Type set by plotimage | (gr) |
| iso | ISO speed setting | (for annotation; normally from EXIF data) | ||
| labcolor | ♦ Plot a*b* color differrence | 0 or 1 [0] | (gr) | |
| lambdadiff | ♠ Wavelength (um) for diffraction-ltd MTF | [0.555] | Wavelength (microns) for diffraction-limited edge and MTF curves in Edge/MTF plot | (gr) |
| lastfiles | Last image file | Default file to open in interactive runs | (-IT) | |
| lens | Lens type | (for annotation; normally from EXIF data) | ||
| lenschart | Lens-to-chart distance in cm. | Used for angular Field of View (FoV) calculation (but not FoV in cm) and for focal length estimate. | ||
| luxinc | Incident light in Lux | Used for ISO speed calculation (using grayscale stepchart) | ||
| lwlpd | Select LW/PH display if 1; LP/PH if 2 | [1] | ||
| magnification | ||||
| mirror | Mirror the input image | 0 or 1 [0] | ||
| mod_apod | Use "modified apodization" noise reduction. | [1] | Not ISO standard, but recommended because it reduces sensitivity to noise. | |
| multistyle | ♦ Type of Multi ROI display | 1-7 [1] | Set in Auto settings or Multi ROI display | (gr) |
| n1090 | Index that specifies rise distance | [1] | 1 for 10-90(% rise distance), 2 for 10-80, 3 for 10-70, 4 for 20-80, 5 for 20-70. | |
| ncolor | ♠ Color space (index) | 1-7 (1 for sRGB) | Color space index, for Color analysis | |
| negative | ♠ Negative (IR-edition-only) | 0 or 1 [0] | For negative SFRplus images (IR-edition) | |
| noisehist | ♦ Noise histograms... | Min or Max [Min] | Not recommended. Only for speedup = 0. | (gr) |
| nroi | (unused in SFRplus) | |||
| other | (unused in SFRplus) | |||
| nchan | Channel popup menu | 1-4 | Channel to analyze: 1-4: R, G, B, Y (Luminance) | |
| p3d | 3D plot type | [1] | Type of 3D plot: corresponds to Plot setting for 3D plot display. | (gr) |
| pixelsper | pixels/distance or um/pixel, depending on pixunits_value | (numeric string) [''] | Must contain a valid number for units of cycles/mm, etc. | |
| pixunits_value | ♠ Index of camera pixel pitch units | 1-3 [1] | 'Pixels/inch','Pixels/mm','um/Pixel' | |
| plot3d | ♦ 3D plot in SFRplus Auto | Min or Max [Min] | 3D plot in SFRplus Auto | (gr) |
| plotimage | Image plot type | [1] | Image plot type 1: normal, others for bright colors, lighter, etc. | (gr) |
| plotmax | ♠ Max MTF plot frequency | 1-4 [1] | Plot maximum high frequency: 1 for 2x Nyquist, 2 for 1x Nyquist, 3 for 0.5x Nyquist, 4 for 0.2x Nyquist | |
| pltrad | (Rescharts window when Radial CA plot is displayed) | [1 1 1] | Parameters for Radial Chromatic Aberration plot. Best omitted (use default values). | |
| pltsharp | ♠ Std. sharpening dropdown menu | 0-2 [2] | Standardized sharpening: 0 = omit; 1 = plot std. sharpening (not recommended); 2 = plot oversharpening only. | |
| pop_edge | ♠ Edge display (index) | 1-4 [1] | Edge display (for Edge/MTF plot): 1 = linear profile; 2 = LSF; 3 = edge pixel profile; 4 = edge unnormalized. | (-gr) |
| prevdisp | Preview display popup menu, under the Preview image | [1] (index) | Display type for the Preview in the Blemish settings window | (-IT) |
| profiles | ♠ Color & lightness profiles | Min or Max [Min] | Plot color and uniformity profiles. | (gr) |
| radius | ♠ Radius slider (near oversharpening) | [2] | Radius for Standardized sharpening (if selected). Not recommended. | |
| RGBY_value | ♠ Channel popup menu | 1-8 [4] | Channel(s) to analyze. 10*: R, G, B, Y (Luminance), R-only, G-only, B-only, Y-only | |
| roi | Set during region selection (primarily in the fine adjust window) | 1 1 3264 2448 (typical) | Region of interest (crop) in pixels. [x1 y1 x2 y2] Groups of 4, each group corresponding to a number in nht_save and nwid_save. | |
| roilth | ROI (region) size (length) | 0.5-0.9 [0.85] | Selected in the ROI size slider in the SFRplus setup window. 0.8 is good for most undistorted images. Must be lower for strongly barrel-distorted images | |
| roisel | Region selection | 1-17 | Determines which regions are selected for analysis. Described in ROI selection : Center, 2: Center, corners, etc. See the ROI Selection dropdown menu in the SFRplus settings window. | |
| save_answer | Save window— main answer (unused) | Yes, No | Saved setting not used. | (-IT) |
| save_dir | Set in Save window | (Folder name) | Last folder used to save results | (-IT) |
| saveCSV | Save window | 0 or 1 [-99 = ignore] | Save CSV results. Overrides save_file_list. | |
| saveJSON | Save window | 0 or 1 [-99 = ignore] | Save JSON results. Overrides save_file_list. | |
| saveXML | Save window | 0 or 1 [-99 = ignore] | Save XML results. Overrides save_file_list. | |
| save_file_list | Save window | [1 1 1 0 0 0 0 0 0 0] | List of results to save if element is set to 1: 1: Orig. image, 2: Image LPF, HPF, 3: Image HPF, 4: Image HPF, exag. noise, 5: Blemish summary, 6: Blemish line image, 7: CSV, 8: XML, 9: Blemish count image, 10: JSON | |
| SFRsuffix | Suffix... popup menu in Options II window | 1-3 [1] | Information added to root file name for saving results. 1: Channel - Orientation - Distance from center & ROI number (nn) 2: Channel_ROI_number (nn) 3: Channel - Orientation - Distance from center | |
| shift_dependent_ geometry_recalc | Shift dependent geometry recalculation | 0 or 1 [1] | If set, geometry will be recalculated if the edge locations are close to the edge locations in the previous image. | |
| speedup | ♠ Speedup (checkbox in Settings area) | 0 or 1 [0] | Speedup removes detailed noise and histogram calculations as well as SQF/Acutance calculations. speedup = 1 is recommended if these are not needed. | |
| SQF | ♦ SQF/Acutance (plot) | Min or Max [Min] | Plot SQF/Acutance | (gr) |
| SQFmult | Multi-region SQF/Acutance (plot) | Min or Max [Min] | (gr) | |
| splitcolor | ♦ Split color analysis (plot) | 0 or 1 [0] | Plot split color results from color pattern | (gr) |
| stepchart | ♠ Step chart (checkbox) | 0 or 1 [1] | Analyze grayscale stepchart pattern. Set in SFRplus settings window | |
| stopplot2 | Select parameter for lower stepchart plot | 1-4 [1] | 1: Local contrast, 2: Delta-C, 3: Delta-T (degrees K), 4: Mireds | (gr) |
| tones | ♦ Tonal response & contrast (plot) | Min or Max [Min] | Plot tonal response from grayscale stepchart | (gr) |
| vhdisp | Edges to display for 3D plot: V, H, or V & H | 1-3 [3] | 1: V, 2: H, 3: V & H | (gr) |
| vhor | Select edges to analyze: V, H, or V & H | 1-3 [1] | 1: V, 2: H, 3: V & H | |
| zweights | Weights for calculating weighted means for MTF, etc. | [1 .75 .25] | [center part-way corner] weights (30%, 75% of center-to-corner distance defines regions.) Default is for pictorial images; corner would be higher for technical images. |
Sample data
[sfrplus]
CA = Min
RGBY_value = 4
SFRsuffix = 1
SQF = Min
SQFmult = Min
anlz_rough = 0
aper = 5.6
areanorm = 2 2
bayeraw = 0
bkgnd3d = 0.9
camera = DMC-GF1
chartht = 60
chcontrast = 9 4 0
closefigs = 1
colorchart = 1
colorspace = sRGB
crop_borders = 0 0 0 0
csvbase_header = 2
csvs = 3
cyclesper = Max
cyclesper_value = 4
dbase_plots = 0
disp3d = 2
distort_params = 0 0
edgeIDfile = C:\Imatest\Documents\Companies\MomAndPop\2012-06-09\11_edge_id_selection.txt
edgeMTF = Min
edgecrop = 1
edgerough = Min
emph2 = 0
expert = 1
figsave = 1
filecomb = 0
foclth = 14.0 mm
folder = C:\Imatest\Data\SFRplus\CameraPhones\ HTC\EVO\Samsung\GII
gamma = .5
imageo = Min
invert3d = 0
iso = 100
labcolor = 0
lambdadiff = 0.555
lastfiles = "GII_new_chart_4_4mm_f2.7_i32_20120620131238.jpg" "GII_new_chart_4_4mm_f2.7_i32_20120620131241.jpg"
lens = LUMIX G VARIO 14-45mm F3.5-5.6
lenschart = 45
lensmtf = 0
luxinc =
lwlpd = 1
magnification = 1
mirror = 0
mod_apod = 1
multistyle = 1
n1090 = 1
ncolor = 1
negative = 0
noisehist = Min
nroi = 13
other =
p3d = 6
pixelsper =
pixunits_value = 1
plot3d = Max
plotimage = 1
plotmax = 1
pltrad = 1 1 1
pltsharp = 0
pop_edge = 1
pprofiles = Min
profile = 1
radius = 2
rdnum = 0.3
rdnum2 = 0.2
rdnum3 = 0.2
rdpct = 30
rdpct2 = 20
rdpct3 = 20
rdtype = MTF
rdtype2 = (none)
rdtype3 = (none)
rdunit = 1
rdunit2 = 1
rdunit3 = 1
ref_value = 1
resultsave = 1
roi_mult = 1711 1332 1897 1622;284 129 470 418;3523 123 3709 409;271 2560 457 2850;3527 2530 3713 2817;880 725 1066 1015;879 1948 1065 2239;2929 721 3115 1010;2933 1936 3119 2225;270 1337 456 1627;3531 1328 3717 1614;2101 113 2287 403;1715 2555 1901 2845
roilth = 0.85
roisel = 6
roiwidth = 1
rowdet = 1
saveCSV = 1
saveJSON = 1
saveXML = 0
saveXMLsummary = 0
save_dir = c:\imatest\matlab\trunk\Results
scale3d = 1 1 3 1 1 1 3 1 1 1 3 1 1 1 3 1 1 1 3 1 1 1 3 1 1 1 3 1 1 1 3 1 1 1 3 1 1 1 3 1 1 1 3 1 1 1 3 1 1 1 3 1 1 1 3 1 1 1 3 1 1 1 3 1 1 1 3 1 1 1 3 1 1 1 3 1 1 1 3 1 1 1 3 1 1 1 3 1 1 1 3 1 1 1 3 1 1 1 3 1
select3d = 0 0 0 0 0 0 0 0 0 0 0 0 0 0 0 0 0 0 0 0 0 0 0 0 0
shannon = Min
shutter = 0.3
speedup = 1
splitcolor = 0
stepchart = 1
stepplot2 = 1
tones = Min
vhdisp = 3
vhor = 1
zweights = 1 0.75 0.25