演算法和參考公式
本頁麵包含顏色/色調互動式和顏色/色調自動的演算法和參考公式。由於全部內容都是數學公式,所以大部分文字都是綠色。
背景閱讀:我們經常收到關於色彩空間、色彩空間白點、用於測量 CIELAB 參考檔案的光源、用於測量影像的色溫、它們之間的轉換方法等等方面的難題。為了幫助解答這些問題,我們強烈建議閱讀以下資料: Babelcolor的 Danny Pascale 對RGB顏色空間的評測。 |
RGB 到 CIELAB (L*a*b)
Imatest Color/Tone測量 RGB 影像中的色塊。如何將其轉換為 CIELAB 色彩空間?
imatest測量的大多數影像最初都是影像感測器中的原始影像。為了方便使用,它們會被轉換成可互換的RGB圖像文件,這些文件通常帶有關聯的色彩空間(可能嵌入在文件中)。轉換過程包括去馬賽克、白平衡、色彩校正(通常使用色彩校正矩陣)、伽瑪編碼,以及(程度不一的)銳利化和降噪。在色彩分析中,最重要的模組是白平衡(通常與色彩校正結合)和伽馬編碼。
首先將RGB資料轉換為XYZ格式。維基百科的sRGB頁面就提供了一個例子。影像透過反轉伽瑪編碼進行線性化,然後使用矩陣將線性RGB轉換為XYZ。
接下來, XYZ 資料被轉換為 CIELAB 色彩空間,即 L*a*b* 色彩空間。轉換過程在維基百科的 CIELAB 色彩空間頁面中有詳細介紹。影像的 L*a*b* 值與參考值(對於色卡而言:可以是預設值,也可以是從參考檔案讀取的值)之間的差異,可以用以下幾種顏色差異指標之一來表示。通常首選 ΔE 2000 (ΔE 00 ) 和 ΔC 2000 (ΔC 00 )。
顏色差異(誤差)公式-
你有兩塊顏色不同的長方形色塊。它們之間有多大區別?
維基百科的「色差」頁面對色差的概念和公式進行了簡潔的介紹。本頁面(撰寫於維基百科頁面發布之前)涵蓋了類似的內容。
本頁的符號說明改編自 Gaurav Sharma 編輯、CRC Press 出版的《 數位彩色成像手冊》 (以下簡稱 DCIH)。參考了 DCIH 的線上勘誤表。
在測量色彩誤差時,請記住,準確的色彩不一定等於令人愉悅的色彩。許多製造商會刻意調整色彩,使其更賞心悅目,通常是透過提高飽和度來實現。 (這就是為什麼富士Velvia膠片在1990年推出時如此成功的原因。)在計算色彩誤差時,您可以選擇不使用Colorchecker(或其他色卡)的精確L*a*b*參考值;您可以替換為您自己的增強值。 Imatest Master可讓您從CSV格式的檔案輸入參考值(您可以使用「顏色/色調設定」儲存測量色卡中的值)。
Imatest使用者經常詢問 Colorcheck a*b* 誤差圖中「corr」和「uncorr」的意思。 「corr」表示在進行比較之前,將相機的平均飽和度(平均色度 = mean(sqrt(a* 2 + b* 2 )) 調整為與參考值相同。這是一個非常簡單的校正;它表示如果平均色度與參考值相同,顏色色調的準確度會有多高。詳情請參見下文。
絕對差異(包括亮度)
CIE 1976
CIELAB (L*a*b*) 色彩空間的設計目標是使其在感知上相對均勻。這意味著可感知的顏色差異近似等於 L*a*b* 值之間的歐氏距離。對於顏色 { L 1 *, a 1 *, b 1 *} 和 { L 2 *, a 2 *, b 2 *},其中 Δ L * = L 2 * - L 1 *,Δ a * = a 2 * - a 1 *,Δ b * = b 2 * - b 1 *,
(DCIH(1.42,5.35)。
雖然 ΔE * ab 的計算和理解相對簡單,但它的精確度並不高,尤其對於高飽和度的顏色。 L*a*b* 的感知均勻性不如其設計者預期的那樣。例如,對於飽和度較高的顏色( C * = ( a * 2 + b * 2 ) 1/2 ),人眼對色度變化的敏感度低於對色相相應變化的敏感度。 )或亮度( ΔL *) 。為了解決這個問題,人們建立了幾個額外的色差公式。在這些公式中,最小可覺差(JND)用橢球體而不是圓形來表示。
CIE 1994
CIE-94 色差公式Δ E * 94比Δ E* ab 更能衡量感知到的顏色差。
(DCIH(5.37);省略設定為 1 的常數),其中
S C = 1 + 0.045 C * ; S H = 1 + 0.015 C *(DCIH (1.53, 1.54) )
[ (幾何平均色度)對於顏色 1 和 2 給出對稱的結果。然而,當其中一個顏色(以下標s表示)是標準色時,計算SC和SH時,最好使用標準色的色度C s * = ( a s * 2 + b s * 2 ) 1/2 。非對稱方程式由 Bruce Lindbloom 使用。
(色調差異;DCIH(5.36))
(色度差異)
CMC——CMC色差公式被紡織業用於布料比對,但在攝影行業尚未廣泛應用。此公式略微不對稱:下標s表示標準(參考)測量值。 CMC是英國染料及色彩師協會(Society of Dyers and Colourists (UK))色彩測量委員會的縮寫。我們在此提及僅作參考。 ΔE * CMC ( l,c ) = ( ( ΔL * ⁄ lS L ) 2 + ( ΔC * ⁄ c S C ) 2 + ( ΔH * ⁄ S H ) 2 ) 1/2 (DCIH (5.37) ),其中 Δ E * CMC (1,1) ( l = c = 1) 用於圖形藝術感知性測量, Imatest也使用了此測量方法。 S L = 0.040975 L s * ⁄ (1+0.01765 L s *) ; L s * ≥ 16 (DCIH (1.48) ) = 0.511 ; L s * < 16 S C = 0.0638 C s * ⁄ (1+0.0131 ) + 0.638 ; S H = S C ( T CMC F CMC + 1 - F CMC ) (DCIH (1.49, 1.50) ) F CMC = ( ( C s * ) 4 ⁄ ( ( C s * ) 4 + 1900 ) ) 1/2 (DCIH (1.51); T CMC = 0.56 + | 0.2 cos( h s * + 168°) | 164° ≤ h s * ≤ 345° (DCIH (1.52) ) = 0.36 + | 0.4 cos( h s * + 35 °) | ΔH*和ΔC * 的公式與 CIE-94 相同。 |
CIEDE2000
CIEDE2000 公式(ΔE <sub>oo</sub>和 ΔC <sub>oo</sub> )是目前最佳的顏色差異度量方法,並且比之前的公式更精確。此處省略公式,因為它們在維基百科的「顏色差異」頁面和 Gaurav Sharma 的CIEDE2000 顏色差異公式網頁中均有給出。參數k<sub> L</sub> 、 k<sub> C</sub>和k<sub> H </sub> 的預設值皆為 1。
CIE 1976 色差度量標準(ΔE * ab …)仍然是最常用的標準。 CIE 1994 標準更加精確和穩健,並且保留了相對簡單的公式。 CIEDE2000 公式(DCIH,第 1.7.4 節,第 34-40 頁)的複雜性減緩了其廣泛應用,但現在它已成為公認的標準。 CIEDE2000色差度量標準是最佳選擇。
色度差 ΔC(不考慮亮度差異的色彩差異)
曝光誤差會嚴重影響色差Δ E* ab 、Δ E * 94和 Δ E * 00 。由於將色差與曝光誤差分開來看是有用的,因此我們定義了省略 Δ L * 的色差。
(這是一種更通用的形式:去掉 Delta-L 的 Delta-E。)
Δ C 00從Δ E 00 (平方根)方程式中省略了( Δ L' ⁄ k L S L ) 2項(參見Sharma )。
這些公式並不能完全消除曝光誤差的影響,因為 a* 和 b* 值本身也會受到曝光的影響,但它們可以將這種影響降低到可控制的程度。需要注意的是, ΔC 的定義可能會造成一些混淆,因為它與純色度差Δ| C *| 不同,其中色度 = | C *| = sqrt(a* 2 + b* 2 )。 Δ | C *| 不適合作為感知測量指標,因為它不包含色調資訊。
Colorcheck 灰階圖中使用的其他顏色差異
第四個 Colorcheck 圖的底部說明了白平衡誤差(與中性灰的偏差),該誤差以四種方式量化。
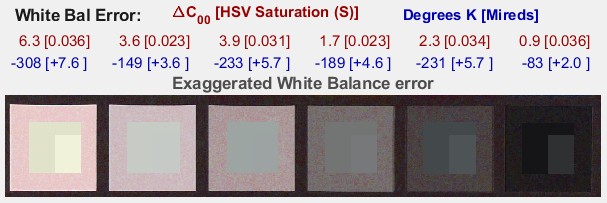
- ΔC2000 。這可能是感知上最有意義的顏色差異指標。請參閱 維基百科「顏色差異」頁面。它與色彩空間無關。
- HSV色彩模型中的飽和度S (酒紅色) 。 S的值範圍為0到1,0代表完全中性的灰色,1代表完全飽和的顏色。與S對應的感知顏色差異取決於色彩空間。
- 相關色溫 (CCT) 誤差(單位為開爾文度,藍色) ,根據 Günther Wyszecki 和 WS Stiles 合著的《色彩科學:概念與方法、定量數據與公式》(第 224-228 頁)中的表格計算得出。色溫(單位為開爾文度)是照明的通用描述單位。較高的色溫在感知上更“冷”,即更偏藍。 CCT 誤差是指照明色溫的變化,這種變化會導致測量值與中性灰的偏差。
- 反色溫( Mireds ,微倒數) (藍色) ,其中 Mireds = 10⁶ / (開爾文度)。與色溫誤差相比,這是一個感知上更均勻的度量標準。它曾用於指定光學色彩校正濾鏡的強度,但在數位時代已很少使用,因為此類濾鏡的需求量大大減少。
顏色差異表示(橢圓)
在Imatest中,顏色差異可以用 L*a*b* 空間 a*b* 平面上的 ΔC 圓或橢圓來表示。它也可以顯示在 xy 和 uv 平面上——這有助於可視化這些空間的感知均勻性(uv 平面的效果不如宣傳的那樣好),但 a*b* 平面通常是最佳表示方法。以下展示了三種 ΔC 表示方法(點擊圖片以查看完整尺寸)。 ΔC 94和 ΔC 2000彼此接近,但與 ΔC ab 截然不同(且優於 ΔC ab )。
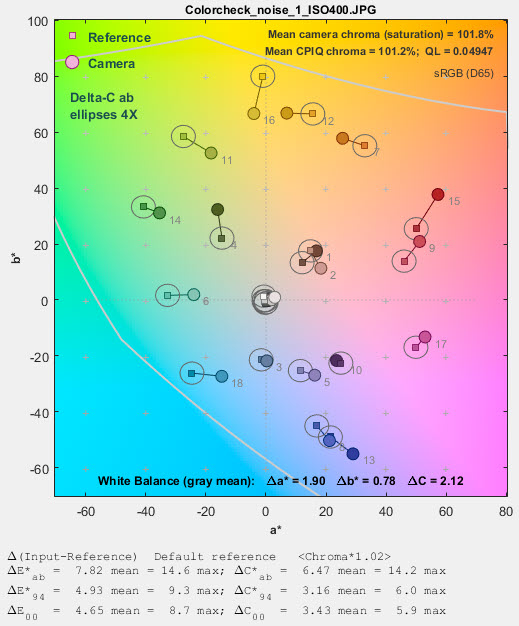 ΔC ab圓 ΔC ab圓 | 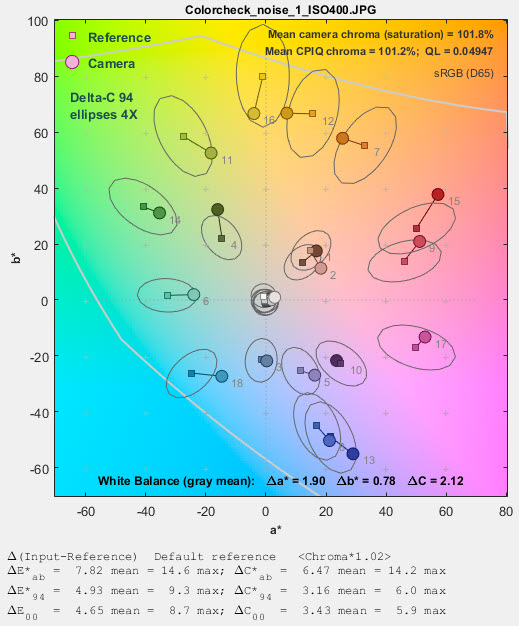 ΔC 94橢圓 ΔC 94橢圓 | 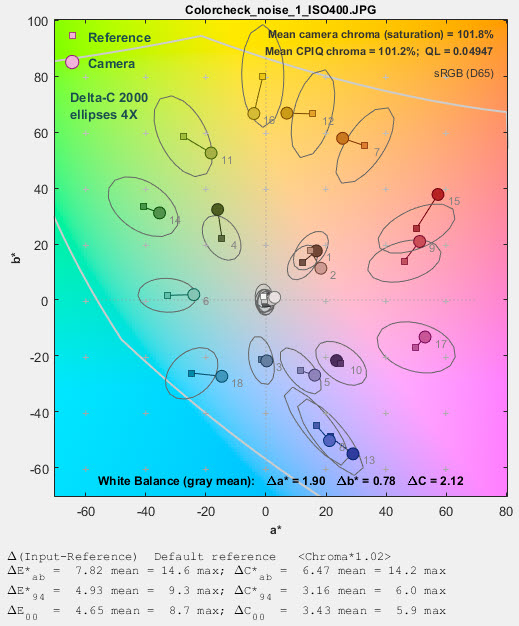 ΔC 2000橢圓 ΔC 2000橢圓 |
在Imatest中加入這些橢圓之前,它們通常不可用。我們之前認為 ΔC 94和 ΔC 2000之間的差異比實際上更大。在「顏色/色調設定」中,可以在「顏色橢圓」下拉式選單中設定這些橢圓。 「顏色/色調自動」使用從「顏色/色調設定」儲存的設定。在“顏色檢查”中,可以在“設定”視窗中選擇它們。
顏色差異視覺化工具
Imatest 5.2新增了一個用於視覺化顏色差異的應用程式。它在高品質校準顯示器(至少支援 sRGB 色域)上效果最佳,但也能在低品質顯示器上提供色彩資訊。若要從Imatest 主視窗開啟它,請按「實用工具」 > 「顏色差異視覺化工具」 ,或在右側方框的「實用工具」標籤中按「顏色差異視覺化工具」 。這將打開一個窗口,左側大窗口顯示 a* = b* = 0,底部小窗口顯示 Δa* = Δb* = 0,以演示旋轉功能。
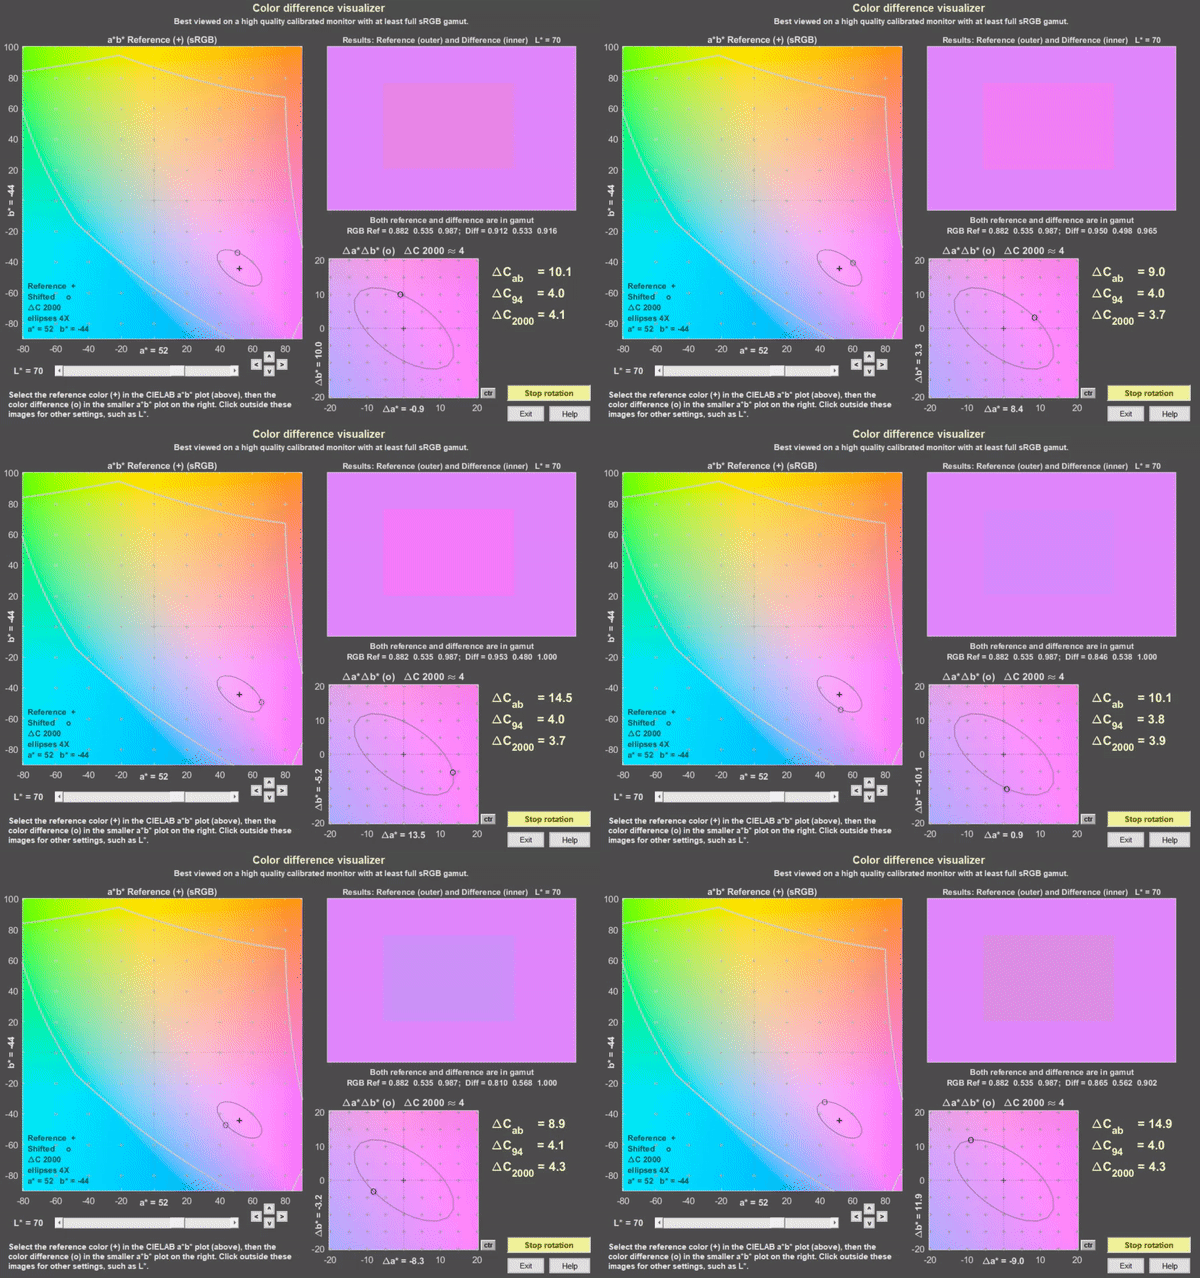
若要查看色差,請點選左側的大 a*b* 顯示框,選擇 a*、b* 參考值。 (a* 和 b* 值將四捨五入到最接近的整數。)然後點擊底部的小顯示框,選擇 Δa* 和 Δb*。色差結果顯示在右上角。在 a*b* 和 Δa*Δb* 顯示框中,「+」表示 a*、b* 值。 參考值和 o 分別表示 Δa* 和 Δb* 的差異。選定的值分別顯示在 x 軸和 y 軸附近。
在結果顯示中,外層區域是 a*、b* 參考值(顯示為洋紅色),內層區域是 a*+Δa*、b*+Δb* 偏移值(如上所示,圍繞 ΔC 2000 ≅ 4 橢圓旋轉)。
a*b* 顯示幕右下方帶有^ 、 v 、 <和>的小按鈕可將 a* 或 b* 設定值加 1。 Δa*Δb* 顯示幕右側的小ctr按鈕可將Δa* = Δb* = 0 設定為 0。
假設採用sRGB 色彩空間。大尺寸 a*b* 影像中的中間灰色曲線代表 L(HSL) = 0.5 時 sRGB 的色域邊界。請注意,這與 CIELAB L* = 50 不同(找到該值的曲線更困難)。
L* 滑桿可用來設定亮度 L*。
右下角的「沿著橢圓旋轉」 按鈕可使 Δa* 和 Δb* 值沿著橢圓移動。預設橢圓對應於 ΔC 2000 = 4。您可以按此按鈕暫停或恢復旋轉。您可以在「設定」下拉式選單中選取(或取消選取) “快速旋轉” 。 由於眼睛的適應方式,旋轉影像中的顏色差異可見度可能比靜態影像更大。
透過「設定」下拉式選單,您可以重設預設值(a* = Δa* = b* = Δb* = 0 和 L* = 70),將 Δa*Δb* 視窗中的軸限制設為 ±20(預設值)或 ±10,或選擇「快速旋轉」。
「顏色橢圓」下拉式選單可讓您設定橢圓類型(無、Macadam、ΔC<sub> ab</sub> 、ΔC <sub>94</sub> 、ΔC <sub>00 </sub> (ΔC<sub> 2000</sub> ))和放大倍率(ΔC<sub>2000</sub>橢圓通常為4倍或2倍;Macadam橢圓為10倍或5倍;1倍太小,幾乎沒有用處)。 ΔC<sub> 2000 </sub>是目前最佳的顏色差異計算公式,但遠非完美。
已校正色度(飽和度)增強/減弱所造成的顏色差異
| 在 Imatest 的最新版本中,這一結果已被弱化,因為調整色度對相機設計師來說並不重要,而且與色彩校正矩陣 (CCM)的性能無關。 |
許多數位相機為了提升影像質量,會刻意提高色度(即飽和度)。這種提高會增加上述ΔE *和ΔC公式中的色彩誤差,但如果適度,則可能改善影像的感知品質。
平均色度百分比為
色度(%) = 100% * (測量平均值( ( a i * 2 + b i * 2 ) 1/2 ) ) ⁄ (色卡平均值( ( a i * 2 + b i * 2 ) 1/2 ) )
= 100% * 平均值 (|測量值C |) ⁄ 平均值 (|理想值C |) ; | C i | = ( a i * 2 + b i * 2 ) 1/2
1 ≤ i ≤ 18(顏色檢查器的前三行)
色度與飽和度感知密切相關,當色度(%) > 100 時,色度會被增強。色度增強會增加 ΔE *和ΔC*色差測量。由於在影像編輯器中很容易透過飽和度設定來消除色度增強,因此在將平均色度校正(歸一化)至 100% 後測量色差會更有意義。為此,需要將歸一化的a <sub>i_corr</sub>和b<sub> i_corr</sub>值代入上述公式中,以代替測量值(相機測量值) a <sub>i </sub> 和b<sub> i </sub>。
a i_corr = 100 a i ⁄色度(%) ; b i_corr = 100 b i ⁄色度(%)
ColorChecker 的參考值保持不變。色度校正後的色彩差異分別表示為 Δ C* ab (corr)、Δ C* 94 (corr) 和 Δ C* 2000 (corr)。
平均值和均方根值
Colorcheck 圖 3 顯示了校正飽和度和未校正的ΔC * ab的平均值和均方根值,其中
mean( x ) = Σ x i ⁄ n ,其中 x 為 n 個值。
RMS( x ) = σ( x ) = (Σ x i2 ⁄ n ) 1/2對於 n 個 x 值。
均方根值之所以重要,是因為它更重視較大的誤差。
顏色檢查演算法
- 確定 24 個 ColorChecker 區域的興趣區域 (ROI)。
- 計算底部一行六個灰階影像區塊的統計數據,包括平均像素值以及對感興趣區域(ROI)內像素值進行二階多項式擬合的結果——該擬合值將從像素值中減去以計算雜訊。它消除了非均勻光照的影響。計算每個影像區塊的雜訊。
- 利用底部灰階區域 2-5 的平均像素值(忽略極端值:白色和黑色),將平均像素響應擬合到一個數學函數(實際上是兩個函數)。這需要一些解釋。
採集設備(相機或掃描器)響應的簡化方程式為:
歸一化像素等級 = (像素等級⁄ 255) = k 1曝光gamc
Gamc 是採集設備的伽瑪值。顯示器也有伽瑪值,定義為 gamma = gamm。
顯示器亮度 = (像素級⁄ 255) γ
兩種伽馬值都會影響最終影像的對比。
系統 gamma = gamc * gamma
對於數位相機,Gamc 通常約為 0.5 或 1/2。 Macintosh 系統的 Gamm 為 1.8;Windows 系統和幾種常用色彩空間(例如 sRGB、Adobe RGB 1998 等)的 Gamm 為 2.2。當系統 Gamma 值略大於 1.0 時,影像通常看起來最佳,但這並非總是如此——尤其是在對比度高的場景中。有關 Gamma 的更多信息,請參閱術語表、使用 Imatest SFR和顯示器校準。
利用公式,密度 = - log 10 (暴露量) + k ,
log10 (歸一化像素等級)= log10 ( k1曝光gamc )= k2 - gamc * 密度
這是一個不錯的斜率為 gamc 的一階方程,如圖中藍色虛線所示。但它的精度不高。二階方程式的效果好得多:
log10 (歸一化像素等級)= k3 + k4 * 密度 + k5 * 密度2
k₃ 、 k₄和k₅是經由二階迴歸得到的,並在圖中以綠色虛線標示。二階擬合效果非常好。
- HSV顏色表示中的飽和度S定義為S(HSV) = (max(R,G,B)-min(R,G,B)) ⁄ max(R,G,B)。與HSL相比,HSV表示的S與感知白平衡誤差的相關性較高。
第三幅圖下方影像中飽和度提升的方程式為 S' = (1-e -4S ) ⁄ (1-e -4 ),其中 e = 2.71828...
Grayscale levels and exposure error
Colorchecker grayscale patch densities (in the bottom row) are specified as 0.05, 0.23, 0.44, 0.70, 1.05, and 1.50. Using the equation,
for common gamma = 2.2 color spaces such as sRGB and Adobe RGB (see ISO sensitivity, below), the ideal pixel levels would be 236, 195, 157, 119, 83, and 52.
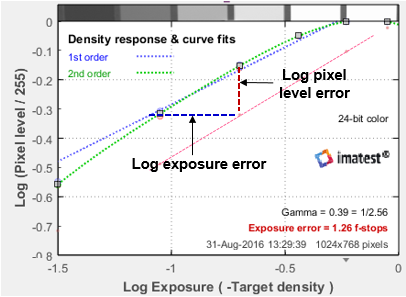 In Imatest 25.2+, ColorChecker Exposure error is measured by comparing the measured pixel levels of patches 2-5 in the bottom row (20-23 in the chart as a whole) with the selected reference levels. White and black patches 1 and 6 of the bottom row (19 and 24) are omitted because they frequently clip.
Gamma is the average slope of log pixel level vs. Log exposure, measured from patches 2-5 in the bottom row, shown on the right as a diagonal dotted blue line (·········). Pixel level is approximately proportional to exposuregamma, hence log10(exposure) is proportional to log10(pixel level) ⁄ gamma, the log exposure error for an individual patch is
Using the mean value of Δ(log exposure) for Colorchecker patches 2-5 and the equation, f-stops = 3.32 * log exposure,
NOTE: For Stepchart and Color/Tone grayscale charts, patches with reference densities between 0.1 and 0.8 are used for calculating Exposure error, with the exception of the ColorChecker Classic starting in 25.2, which specifically uses gray patches 2-5.
|
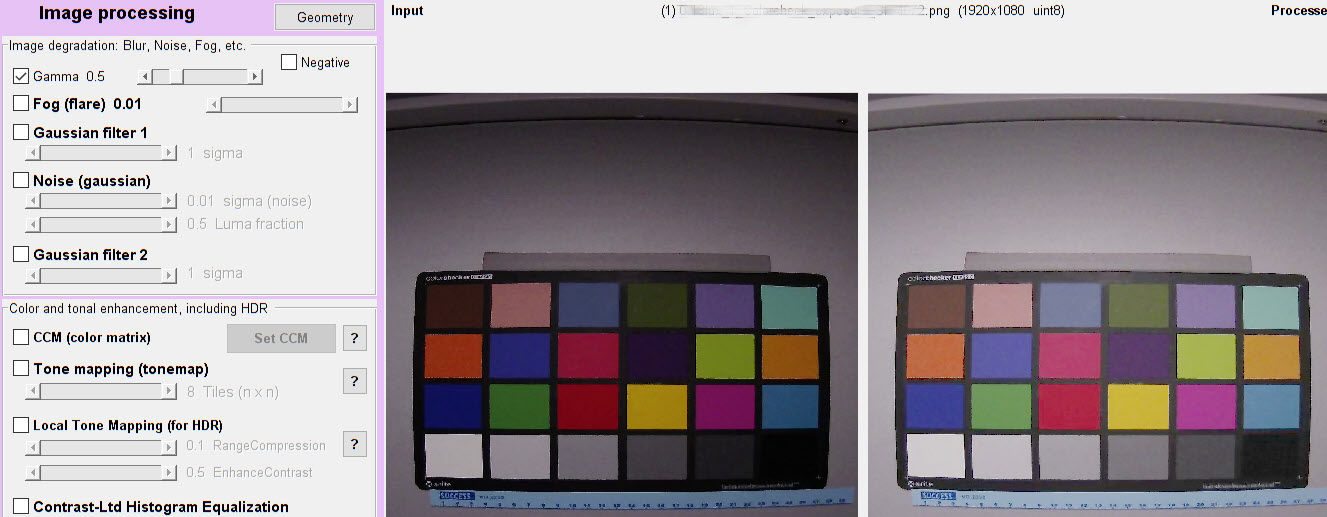
Changes to exposure error calculation in Imatest 5.1+ after December 2018 It is important to note that an image with gamma near 1 may look very dark, even though it is well-exposed. This is illustrated by the two images displayed in Image Processing, where the image on the left has gamma = 0.9 and the image on the right— derived from the image on the left (the same capture)— has gamma = 0.45.
When run in Colorcheck or Color/Tone, both images have near-zero exposure error. But you wouldn't expect this from casually looking at the left image. |
Color Contrast Enhancement (CCE)
Color Contrast Enhancement (CCE) has been added as an optional JSON and CSV output beginning in Imatest Version 25.2. It must be enabled in General Settings > Calculation > CCE Computation. Imatest currently supports CCE calculations using CIE94 and CIEDE2000 color difference formulas. CCE is a metric introduced in 2023 by the FDA, published in the Journal of Imaging Science and Technology as part of the Color Performance Review (CPR) tool for evaluating endoscopy devices [1]. CCE is a metric that evaluates how well an imaging system preserves or enhances the visible differences between colors. Unlike traditional color fidelity measures—which compare how closely a device reproduces absolute colors—CCE focuses on the relative contrast between pairs of colors.
Mathematically, CCE is defined as the ratio of the color difference reproduced by the device to the original color difference in the target.
-
CCE > 1: the system increases contrast between colors.
-
CCE < 1: the system reduces contrast.
-
CCE = 1: the system preserves contrast exactly.
By analyzing all pairs of patches in a test chart, CCE provides insight into whether an imaging pipeline makes colors more or less distinguishable. High CCE values indicate that subtle differences between colors are maintained or enhanced, which is critical for applications like medical imaging, photography, and computer vision where color separation impacts performance.
ISO sensitivity
Two types of ISO sensitivity are calculated: Saturation-based Sensitivity and Standard Output Sensitivity. These measurements are described on the ISO Sensitivity page.
Results (CSV and JSON)
Not all results, for example, ΔH, are displayed well graphically, but they can be found in the CSV and JSON text file output. Here is a sample for the Rezchecker chart (similar colors to the Colorchecker), which can be run in Color/Tone.
JSON
"Delta_E": [9.51,3.87,7.3,6.78,25.1,7.46,12.9,12.6,14,12.5,11.3,11.3,15.4,16.2,18.6,11.1,7.85,5.84,2.93,17.2,12.8,7.67,12.8,10.2,8.13,15.3,11.7,12.7,7.27,15.3],
"Delta_C": [6.14,1.49,5.76,5.08,22,2.11,6.5,9.51,9.91,9.34,8.15,6.63,4.87,12.2,14.5,5.7,6.36,5.46,2.8,8.94,9.78,4.44,5.59,3.04,2.75,7.83,10.4,10.7,7.11,7.86],
"Delta_E94": [7.97,3.64,6.06,5.22,17.2,7.22,11.4,9.42,10.3,12.2,11.2,11.2,15.4,11,12.5,11,7.65,5.8,2.91,15.6,9.7,7.59,12.7,10.1,8.11,13.4,7.91,8.18,2.74,13.7],
"Delta_C94": [3.27,0.696,4.07,2.67,12,0.971,1.96,4.49,2.66,8.87,7.94,6.43,4.67,3,4.15,5.47,6.11,5.42,2.78,5.21,5.08,4.3,5.41,2.96,2.71,2.38,5.84,4.4,2.3,3.94],
"Delta_E2000": [7.06,3.07,7.22,4.88,16.9,7.14,11.1,8.23,7.68,9.22,8.56,8.47,11.6,10.1,11.1,9.26,6.91,5.29,2.79,13.8,9.44,6.54,9.48,6.89,5.62,12.8,8.68,7.31,2.52,10.6],
"Delta_C2000": [3.7,0.697,5.72,2.71,12.4,1.06,2.04,4.82,3.12,7.69,6.94,5.85,4.49,3.24,4.6,5.24,5.6,4.86,2.69,7.25,4.61,4.27,4.88,2.87,3.13,2.52,7.72,5.37,2.26,4.45],
"Delta_L": [57.1,-7.26,-3.57,-4.48,-4.49,61.2,-12.2,48.5,84.2,85.3,79.2,-7.15,-11.2,45.9,44.8,47.1,80.4,-8.28,-9.9,-8.35,-7.85,-9.11,-14.6,-10.6,-11.8,-9.55,-4.6,2.08,-0.832,-14.7,-8.26,6.26,11.5,9.7,7.65,-13.1,51.9,-5.34,6.9,1.49,-13.2,45.8],
"Delta_Chroma": [5.59,-6.07,1.48,-2.44,-4.45,5.11,-12.8,7.87,7.94,8.31,6.34,-2.11,-6.47,7.72,7.51,6.9,6.43,-8.38,-9.05,9.18,7.7,6,4.07,-12.1,-14.1,4.64,5.46,5.31,2.56,-0.637,-4.9,4.08,5.59,2.41,1.67,-7.77,8.4,1.63,6.55,6.49,-7.04,3.91],
"Delta_Hue_Distance": [0,0.967,0.213,5.22,2.45,0,17.8,0,0,0,0,0.165,0.594,0,0,0,0,4.48,4.04,0,0,0,0,0.958,3.13,0,0,0,0,8.92,8.46,0,0,0,0,0.899,0,10.3,8.48,2.91,3.51,0],
"Delta_Hue_Degrees": [0,-3.31,0.456,14,5.76,0,31.3,0,0,0,0,0.374,0.694,0,0,0,0,-8.88,3.02,0,0,0,0,-0.88,3.42,0,0,0,0,10.8,-10.3,0,0,0,0,-1.07,0,11.4,6.56,-2.6,-8.1,0],
"mean_Delta_E": [11.5],
"mean_Delta_C": [7.43],
"mean_Delta_E94": [9.63],
"mean_Delta_C94": [4.41],
"mean_Delta_E2000": [8.34],
"mean_Delta_C2000": [4.56],
"mean_Delta_L": [13.7],
"mean_Delta_Chroma": [1.39],
"mean_Delta_Hue_Distance": [1.99],
"mean_Delta_Hue_Degrees": [2.93],
"max_Delta_E": [25.1],
"max_Delta_C": [22],
"max_Delta_E94": [17.2],
"max_Delta_C94": [12],
"max_Delta_E2000": [16.9],
"max_Delta_C2000": [12.4],
"max_Delta_L": [85.3],
"max_Delta_Chroma": [9.18],
"max_Delta_Hue_Distance": [17.8],
"max_Delta_Hue_Degrees": [31.3],
CSV
| Color errors for reference vs input patches | |||||||||
| Patch | Delta-E* | Delta-C | Delta-E*94 | Delta-C 94 | Delta-E*CMC | Delta-C CMC | Delta-E 00 | Delta-C 00 | Row |
| 2 | 9.51 | 6.14 | 7.97 | 3.27 | 8.61 | 3.94 | 7.06 | 3.7 | 1 |
| 3 | 3.87 | 1.49 | 3.64 | 0.7 | 2.99 | 0.83 | 3.07 | 0.7 | 1 |
| 4 | 7.3 | 5.76 | 6.06 | 4.07 | 6.37 | 4.85 | 7.22 | 5.72 | 1 |
| 5 | 6.78 | 5.08 | 5.22 | 2.67 | 5.3 | 2.94 | 4.88 | 2.71 | 1 |
| 7 | 25.13 | 21.96 | 17.16 | 12.04 | 16.37 | 12.01 | 16.92 | 12.37 | 2 |
| 12 | 7.46 | 2.11 | 7.22 | 0.97 | 6.32 | 1.13 | 7.14 | 1.06 | 2 |
| 13 | 12.94 | 6.5 | 11.35 | 1.96 | 10.29 | 2.49 | 11.13 | 2.04 | 3 |
| 18 | 12.61 | 9.51 | 9.42 | 4.49 | 8.04 | 4.84 | 8.23 | 4.82 | 3 |
| 19 | 14.01 | 9.91 | 10.26 | 2.66 | 8.06 | 3.64 | 7.68 | 3.12 | 4 |
| 20 | 12.52 | 9.34 | 12.18 | 8.87 | 14.28 | 13.09 | 9.22 | 7.69 | 4 |
| 21 | 11.32 | 8.15 | 11.17 | 7.94 | 13.2 | 12.02 | 8.56 | 6.94 | 4 |
| 22 | 11.27 | 6.63 | 11.15 | 6.43 | 11.62 | 9.65 | 8.47 | 5.85 | 4 |
| 23 | 15.43 | 4.87 | 15.37 | 4.67 | 12.68 | 6.87 | 11.62 | 4.49 | 4 |
| 24 | 16.17 | 12.19 | 11.04 | 3 | 9.63 | 4.21 | 10.12 | 3.24 | 4 |
| 25 | 18.63 | 14.45 | 12.47 | 4.15 | 12.83 | 5.5 | 11.07 | 4.6 | 5 |
| 26 | 11.12 | 5.7 | 11.01 | 5.47 | 10.87 | 8.01 | 9.26 | 5.24 | 5 |
| 27 | 7.85 | 6.36 | 7.65 | 6.11 | 9.78 | 9.01 | 6.91 | 5.6 | 5 |
| 28 | 5.84 | 5.46 | 5.8 | 5.42 | 8.64 | 8.42 | 5.29 | 4.86 | 5 |
| 29 | 2.93 | 2.8 | 2.91 | 2.78 | 4.41 | 4.32 | 2.79 | 2.69 | 5 |
| 30 | 17.17 | 8.94 | 15.55 | 5.21 | 16.51 | 6.26 | 13.76 | 7.25 | 5 |
| 31 | 12.8 | 9.78 | 9.7 | 5.08 | 8.65 | 4.76 | 9.44 | 4.61 | 6 |
| 32 | 7.67 | 4.44 | 7.59 | 4.3 | 10.26 | 6.45 | 6.54 | 4.27 | 6 |
| 33 | 12.79 | 5.59 | 12.71 | 5.41 | 23.74 | 8.17 | 9.48 | 4.88 | 6 |
| 34 | 10.17 | 3.04 | 10.14 | 2.96 | 19.49 | 4.41 | 6.89 | 2.87 | 6 |
| 35 | 8.13 | 2.75 | 8.11 | 2.71 | 15.51 | 4.09 | 5.62 | 3.13 | 6 |
| 36 | 15.29 | 7.83 | 13.35 | 2.38 | 12.18 | 3.04 | 12.82 | 2.52 | 6 |
| 38 | 11.7 | 10.42 | 7.91 | 5.84 | 9.71 | 6.99 | 8.68 | 7.72 | 7 |
| 39 | 12.74 | 10.71 | 8.18 | 4.4 | 8.02 | 6.04 | 7.31 | 5.37 | 7 |
| 40 | 7.27 | 7.11 | 2.74 | 2.3 | 2.98 | 2.75 | 2.52 | 2.26 | 7 |
| 41 | 15.34 | 7.86 | 13.75 | 3.94 | 16.52 | 4.45 | 10.58 | 4.45 | 7 |
| Delta-E* | Delta-C | Delta-E*94 | Delta-C 94 | Delta-E*CMC | Delta-C CMC | Delta-E 00 | Delta-C 00 | ||
| Mean | 11.46 | 7.43 | 9.63 | 4.41 | 10.79 | 5.84 | 8.34 | 4.56 | |
| Maximum | 25.13 | 21.96 | 17.16 | 12.04 | 23.74 | 13.09 | 16.92 | 12.37 | |
| Additional color errors and values | |||||||||
| Patch | Delta-L* | Delta-Chroma | |Delta-Hue dist| | |Delta-Hue degs| | Note: Delta-Hue is undefined for grayscale patches (a* & b* near 0) | ||||
| 2 | 57.12 | 5.59 | 0 | 0 | |||||
| 3 | -7.26 | -6.07 | 0.97 | -3.31 | |||||
| 4 | -3.57 | 1.48 | 0.21 | 0.46 | |||||
| 5 | -4.48 | -2.44 | 5.22 | 13.97 | |||||
| 7 | -4.49 | -4.45 | 2.45 | 5.76 | |||||
| 12 | 61.23 | 5.11 | 0 | 0 | |||||
| 13 | -12.22 | -12.79 | 17.85 | 31.31 | |||||
| 18 | 48.52 | 7.87 | 0 | 0 | |||||
| 19 | 84.23 | 7.94 | 0 | 0 | |||||
| 20 | 85.25 | 8.31 | 0 | 0 | |||||
| 21 | 79.24 | 6.34 | 0 | 0 | |||||
| 22 | -7.15 | -2.11 | 0.17 | 0.37 | |||||
| 23 | -11.18 | -6.47 | 0.59 | 0.69 | |||||
| 24 | 45.95 | 7.72 | 0 | 0 | |||||
| 25 | 44.78 | 7.51 | 0 | 0 | |||||
| 26 | 47.11 | 6.9 | 0 | 0 | |||||
| 27 | 80.38 | 6.43 | 0 | 0 | |||||
| 28 | -8.28 | -8.38 | 4.48 | -8.88 | |||||
| 29 | -9.9 | -9.05 | 4.04 | 3.02 | |||||
| 30 | -8.35 | 9.18 | 0 | 0 | |||||
| 31 | -7.85 | 7.7 | 0 | 0 | |||||
| 32 | -9.11 | 6 | 0 | 0 | |||||
| 33 | -14.64 | 4.07 | 0 | 0 | |||||
| 34 | -10.62 | -12.15 | 0.96 | -0.88 | |||||
| 35 | -11.75 | -14.11 | 3.13 | 3.42 | |||||
| 36 | -9.55 | 4.64 | 0 | 0 | |||||
| 38 | -4.6 | 5.46 | 0 | 0 | |||||
| 39 | 2.08 | 5.31 | 0 | 0 | |||||
| 40 | -0.83 | 2.56 | 0 | 0 | |||||
| 41 | -14.66 | -0.64 | 8.92 | 10.84 | |||||
| Delta-L* | Delta-Chroma | |Delta-Hue dist| | |Delta-Hue degs| | ||||||
| Mean | 13.73 | 1.39 | 1.99 | 2.93 | Maximum | 85.25 | 9.18 | 17.85 | 31.31 |
| Mean camera chroma % | 107.1 | ||||||||
| Mean chroma level CPIQ % | 89.96 | ||||||||
參考
- W.-C. Cheng, “色彩性能評估(CPR):內視鏡設備色彩性能分析器” , 《成像科學與技術雜誌》 ,第67卷,第5期,第1-9頁,2023年, doi: 10.2352/J.ImagingSci.Technol.2023.67.5.5.6 。