Uses/Purpose
This metric is intended to be used as a way to measure the time a camera system takes to auto-focus. Rise time and settling time are automatically calculated. This measurement does not provide information about the accuracy or precision of auto-focus. To evaluate those measures, several measurements should be performed on the final, settled images and compared.
File Selection and Frame Selection
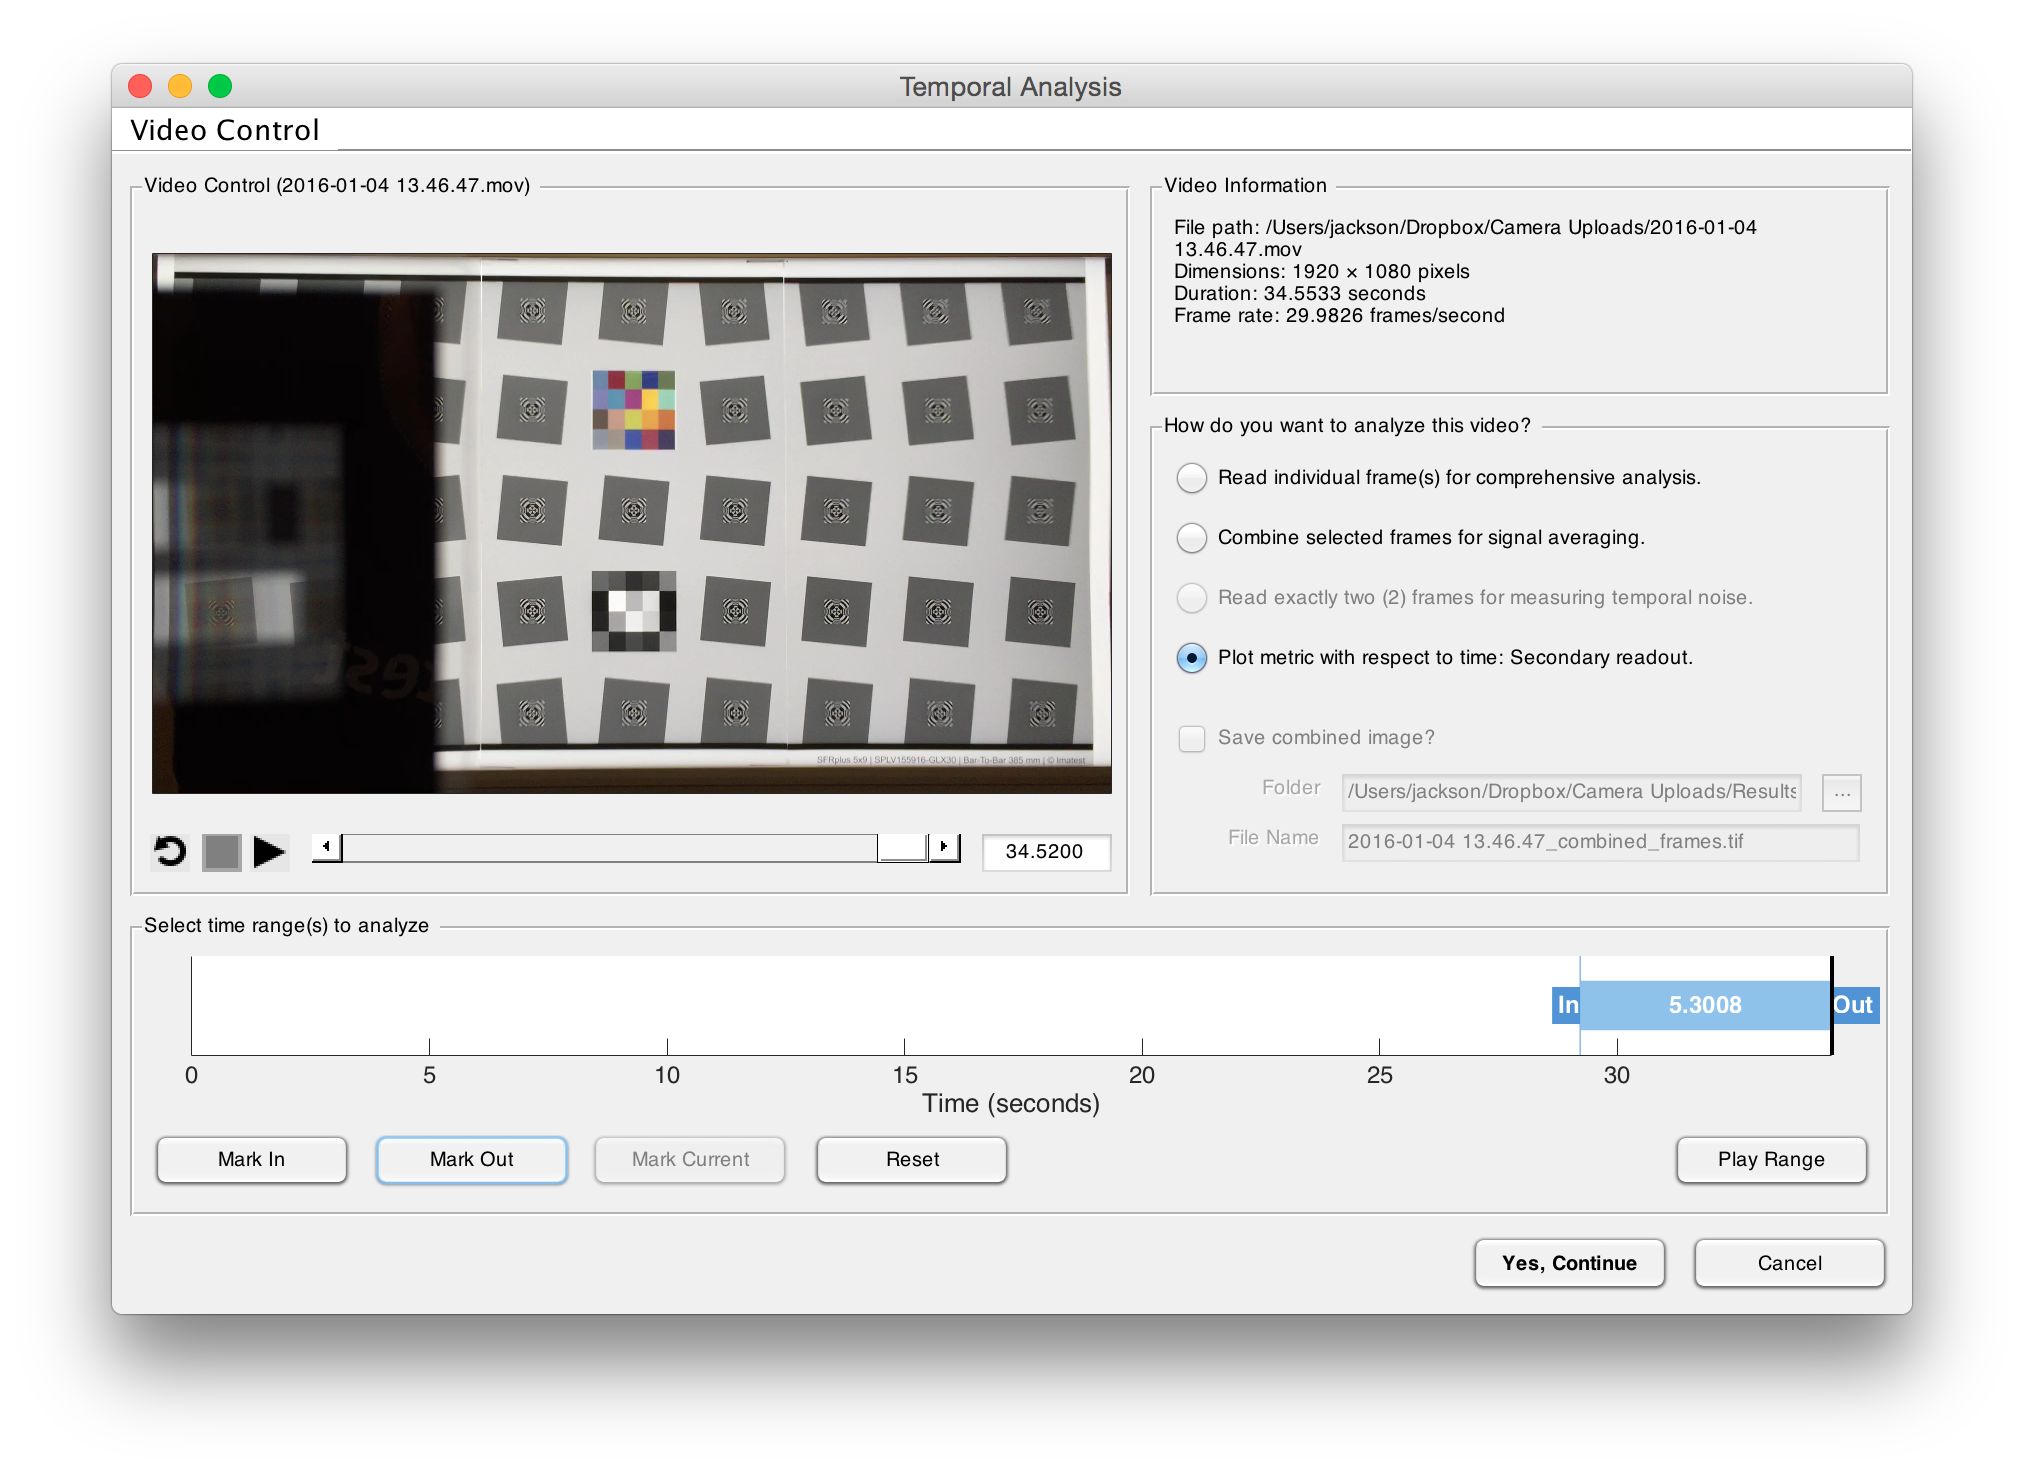
Begin by clicking on SFR from the main window and select a video file. Select the Plot metric with respect to time option and select a range of frames that covers from out-of-focus to in-focus for at least 1-2 seconds. Any shorter and you risk not having enough frames to ensure the AF mechanism has settled completely.
For more details on supported video formats, see Image file formats and acquisition devices
Region Selection
At least one slanted edge should be selected. You may select more than one region but the final rise time and settling time are only calculated for the first region selected. All selected regions will be plotted.
For more details on how to select SFR regions, see SFR Instructions (Selecting the ROI)
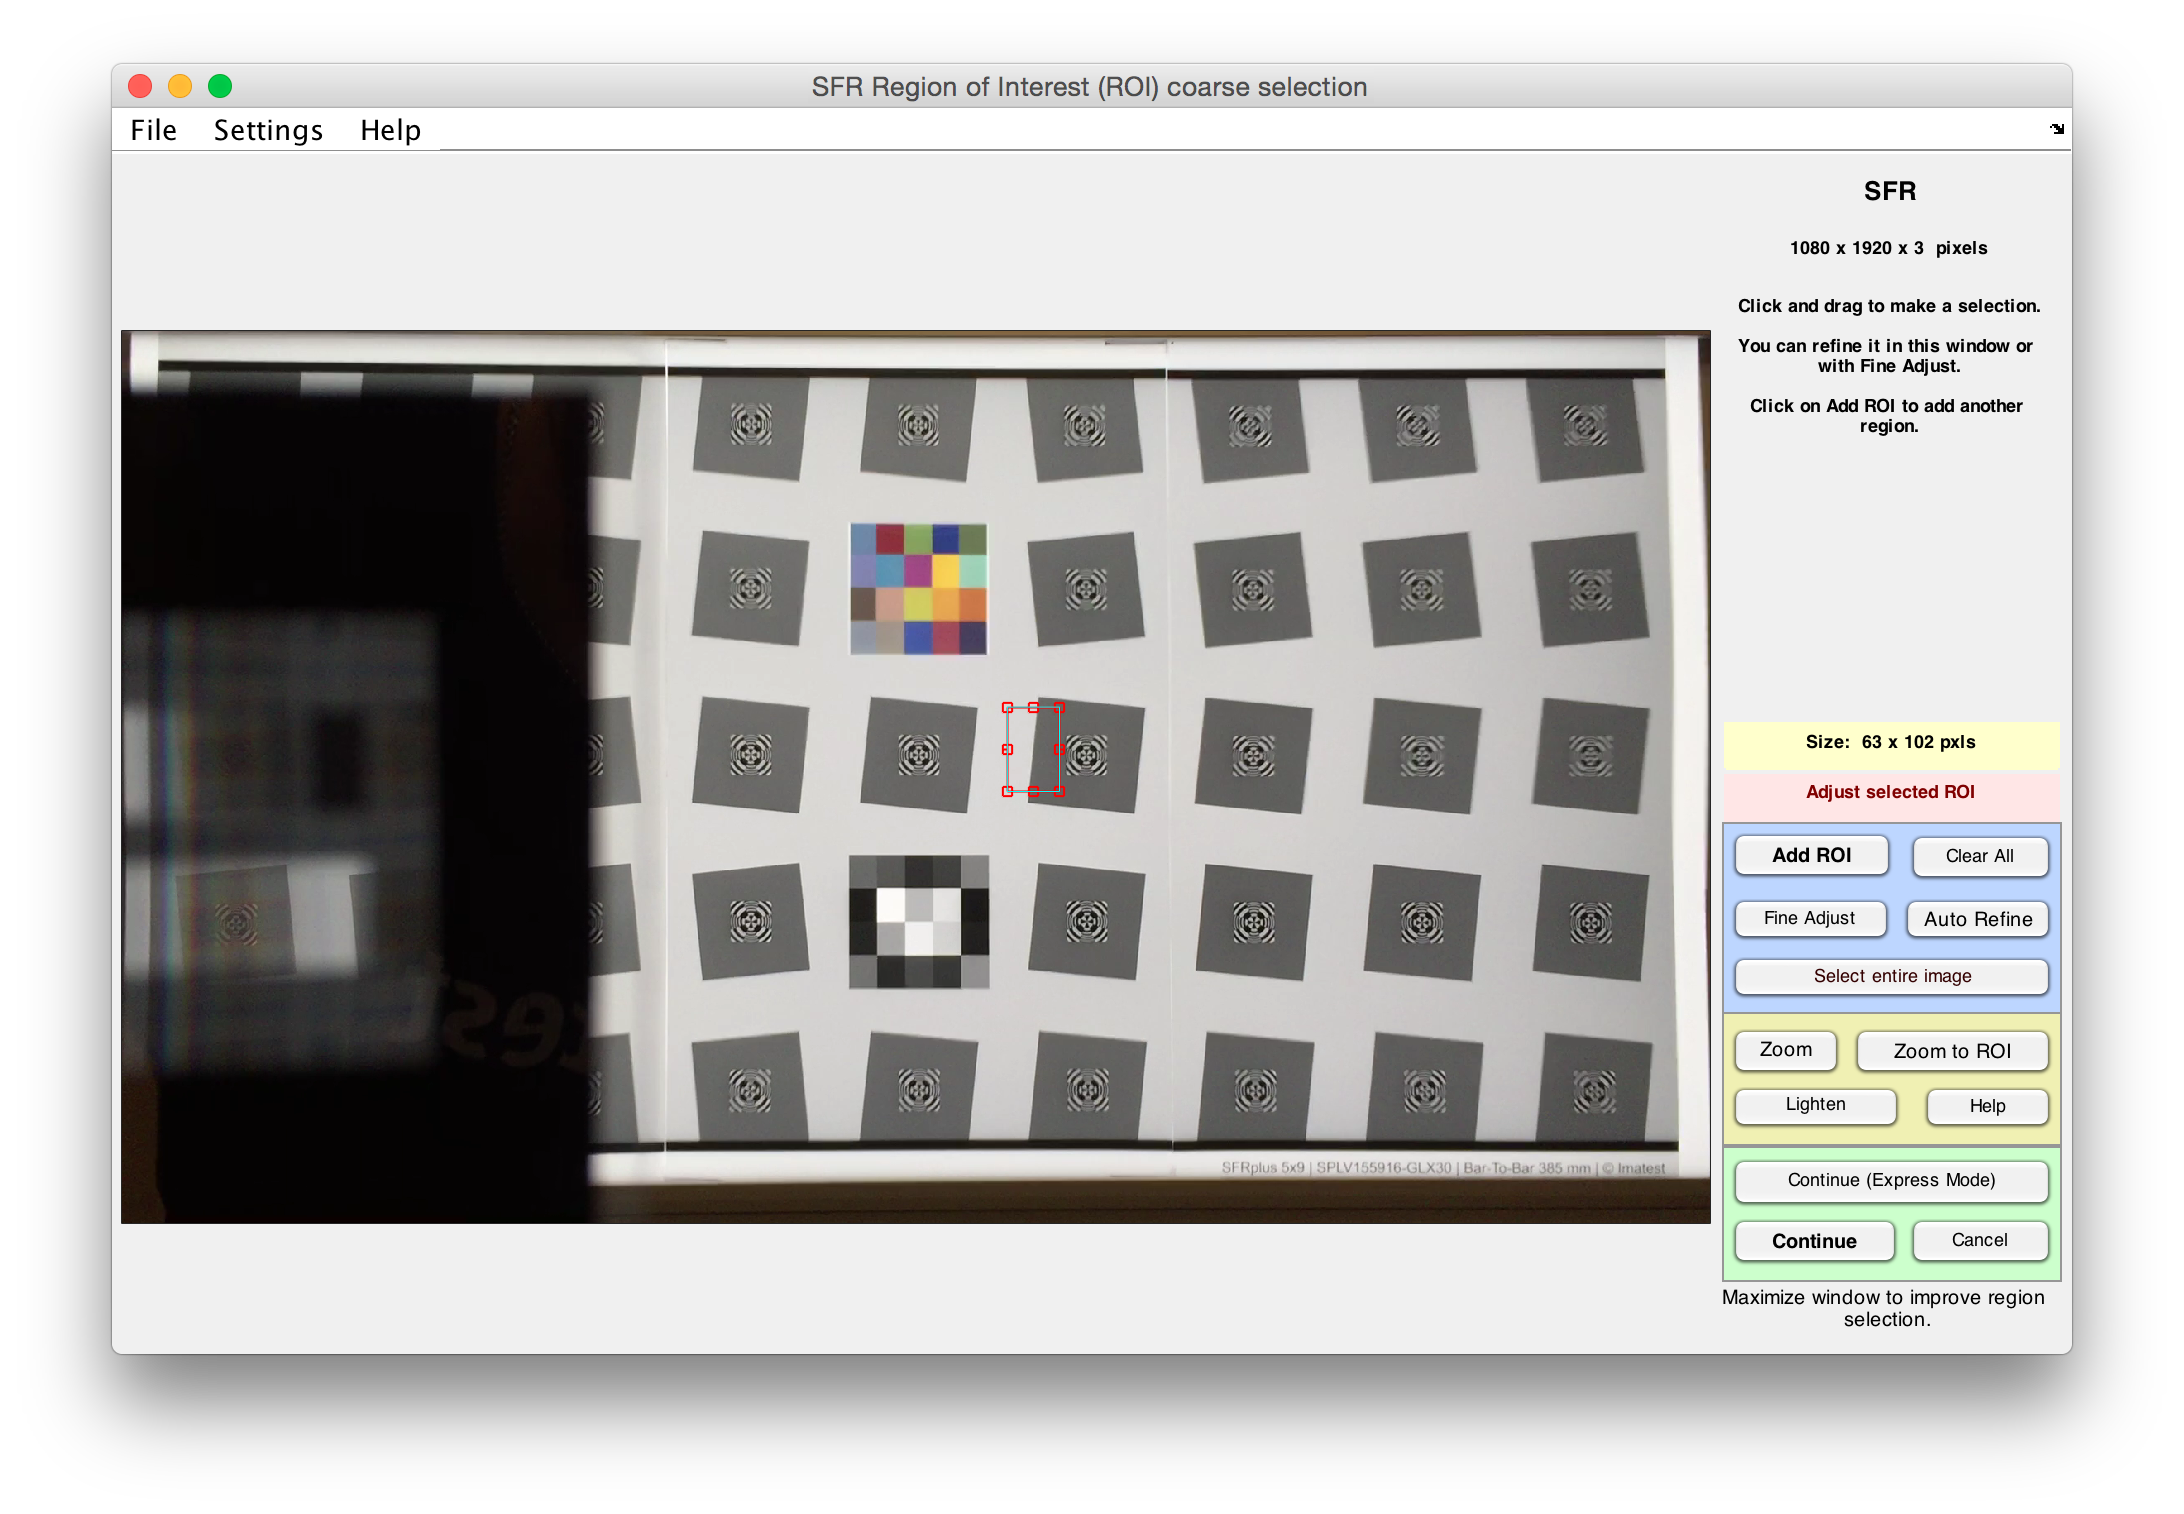
Note that when selecting regions, the last frame in the sequence is used since that frame should be completely in-focus, making region selection easier.
Selecting Plotted Metric
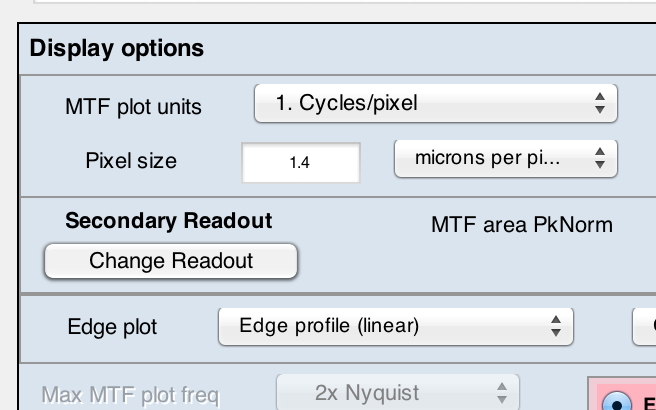
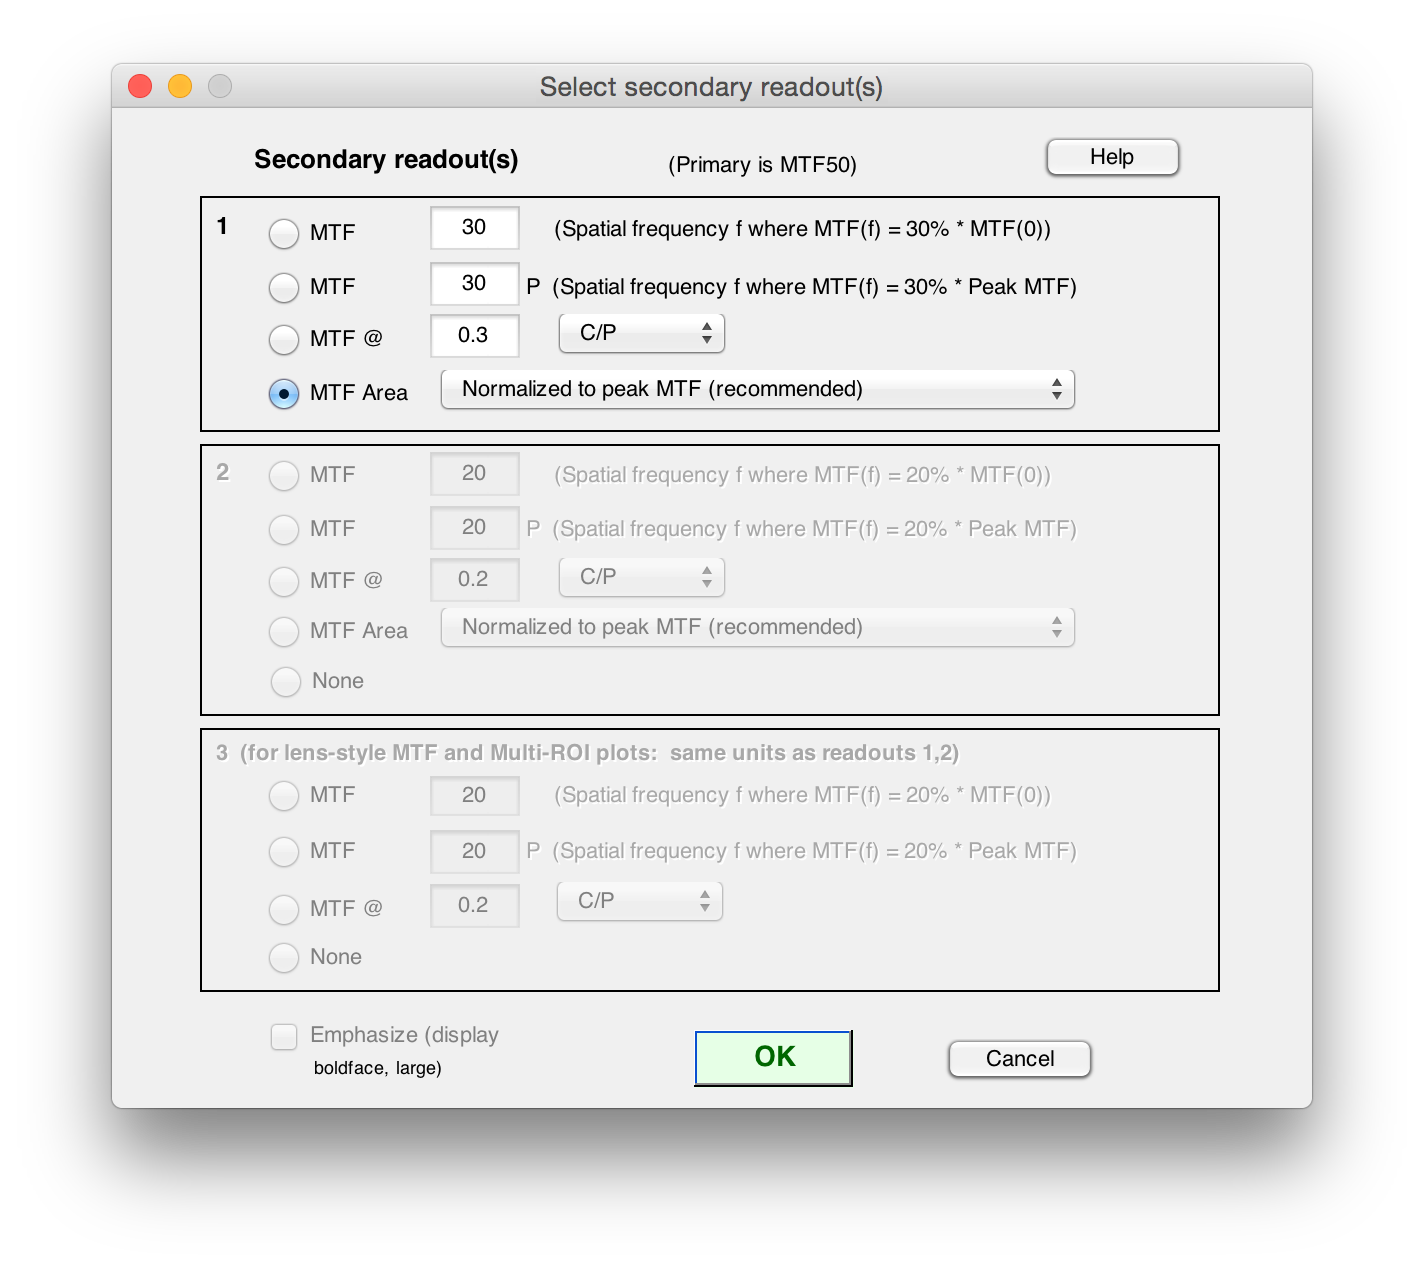
The current Secondary readout metric will be used as the metric for plotting. This can be selected by clicking Change Readout under Secondary Readout and selecting one of the options for the 1st Secondary readout.
The recommended selection for AF testing is MTF area: Normalized to peak MTF (recommended).
Outputs
The final output figure will be displayed at the end of the run and saved to the output save directory if selected. If no plot option is selected, nothing will be displayed. CSV and JSON outputs will always be saved to the output save directory.
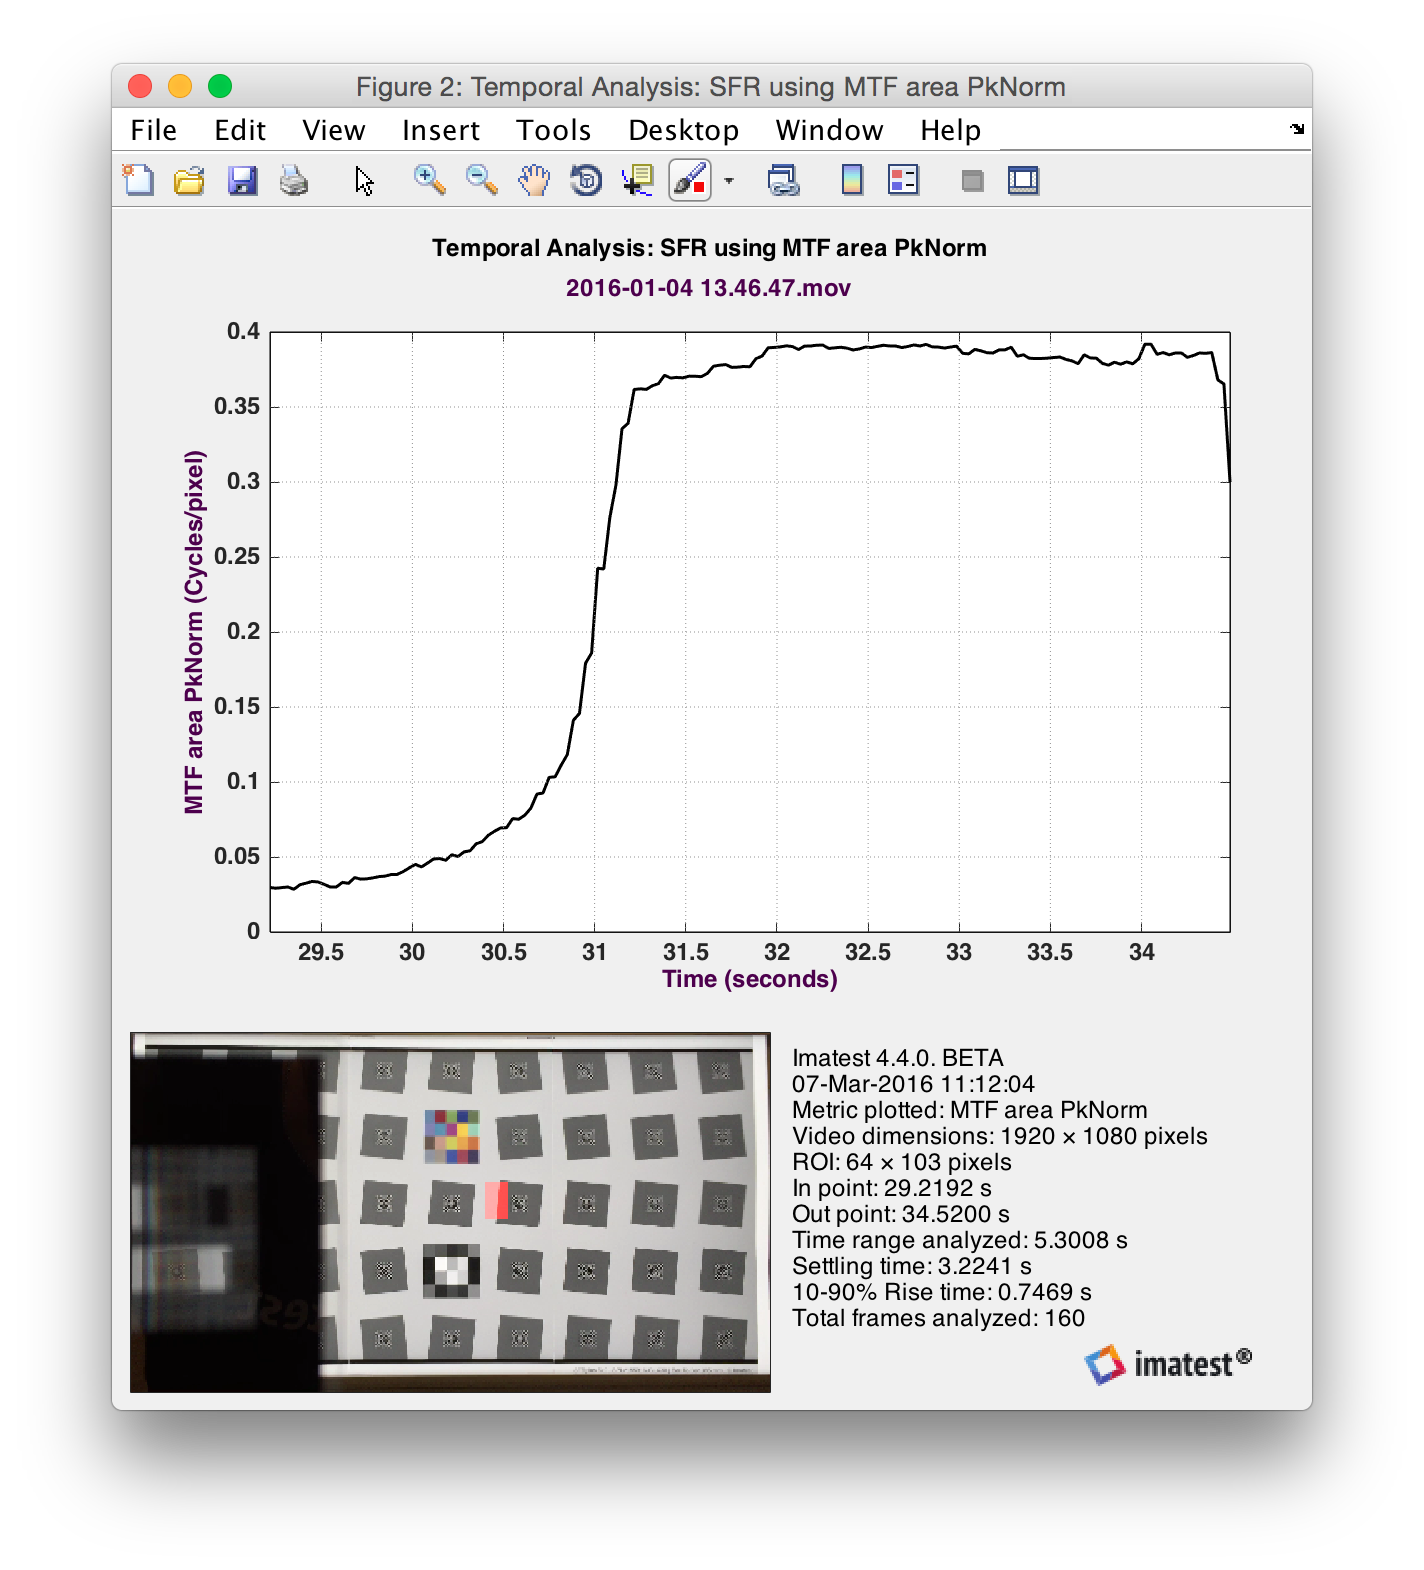
The figure output will contain a plot of the secondary metric with respect to time. The time axis (x-axis) will be in units of seconds and will be in units of absolute time from the video file. The figure will also contain some details about the run including ROI size, in and out points in the video file, total time range, settling time, 10-90% rise time, and total frames analyzed.
JSON
The JSON output file will contain the following structure:
ImatestResults:
AutoFocus:
VideoDimensions:
Width: Video width in pixels
Height: Video height in pixels
InPoint: The selected in-point for the video in seconds
OutPoint: The selected out-point for the video in seconds
TotalTime: The total time evaluated (equivalent to OutPoint – InPoint)
TotalFrames: The total number of frames analyzed. Depending on whether or not the video is variable frame-rate, this may not be equivalent to TotalTime*fram-rate.
SettlingTime: The time taken for the specified metric to settle to +/- 5% of the mean in seconds
RiseTime: The time taken to go from 10% to 90% of the starting mean to the settled mean in seconds
DampingRatio: The damping ratio of the measured state change
Unit: The string name of the selected secondary readout
Time: An array of measured time values in seconds
Metric: The measured value for each point in time. In the units specified in Unit.