Summary table – Detailed uniformity measurements – How we made the measurements
Lightbox summary table: Some may be discontinued
Lightbox | Brightness | Uniformity* | CRI (spec.) | Viewing Area | Dimensions | Controls |
1 to 100,000 lux ** | 90 to 95% | Over 97 | 260 x 220 mm to 1440 x 1100 mm (9 Sizes) | 400 (W) x 380 (H) x 200mm (D) to 1655 x 1296 x 200 mm (9 Sizes) | WiFi, USB, Manual | |
30 to 1,000 lux | 90 to 95% | 229 x 152mm to 907 x 680mm (5 Sizes) | 289 x 212 x 40mm to 967 x 740 x 55mm (5 Sizes) | WiFi, USB, Manual |
*measured using 9 rectangular regions, as described below.
** measured using 30-10,000 lux model, ultra bright version has 90% uniformity
A better color quality measurement? The color quality of light sources is traditionally measured by CRI (Color Rendering Index), which has a maximum value of 100 (%). Recently, doubt has been cast on the accuracy of CRI, and a new Color Rendition measurement has been proposed: IES TM-30-15. It’s unfamiliar and the linked document doesn’t have an equation or algorithm for calculating it from the light spectrum. We’ll wait and see… |
Lightbox Uniformity- Detailed Measurements
For the key measurement, the definition of uniformity is
Uniformity = 100%*(1 – (maximum of 9 regions- minimum of 9 regions) / maximum of 9 regions)
where the 9 rectangular regions (shown in the figures below) include the top, bottom, left, right, 4 corners, and center. The rectangular region dimensions are 10% of the crop width and height and (except for the center region) they are located 5% of the width and height from the boundaries, as described below.
Click on any of the images below to view full-sized.
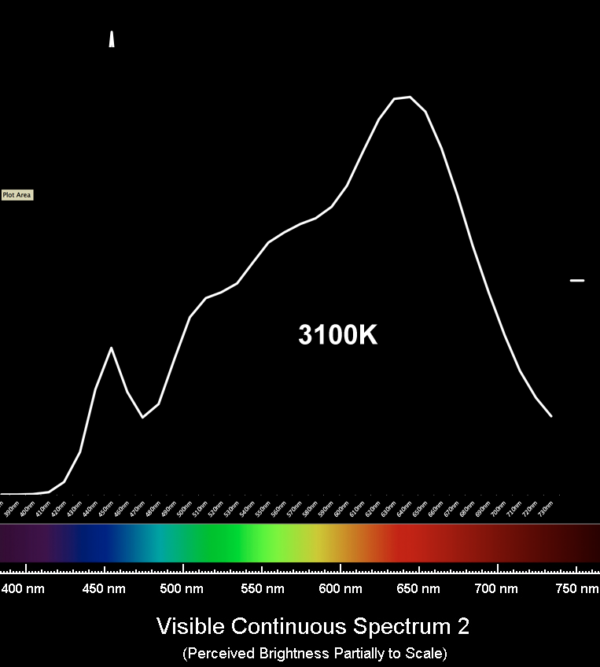
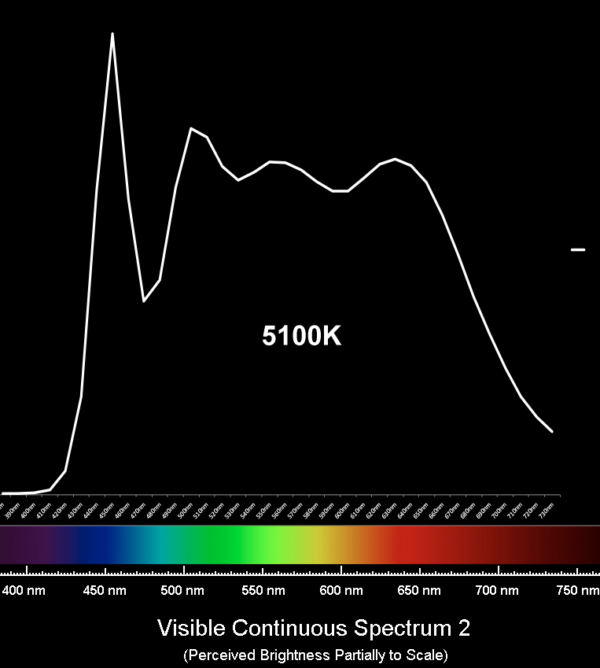
ITI LED LightboxUniformity = 95.2% Response is very even, but unusual in that the center is slightly dimmer than the top and bottom. Note that the contour line increments are 0.01 (1%), lower than the other lightboxes because the ITI is much more uniform. (0.02 contour increments wouldn’t show very much.) The lightbox spectra for the standard 3100K and 5100K settings, provided by ITI, are shown below. | 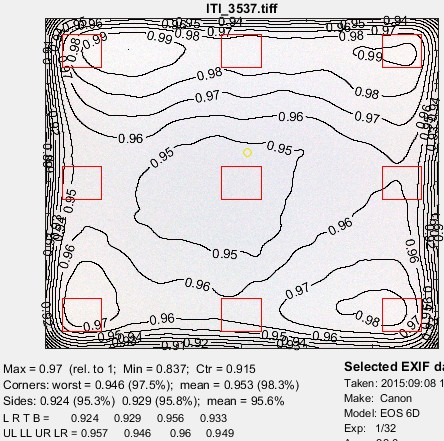 |
 |  |
| 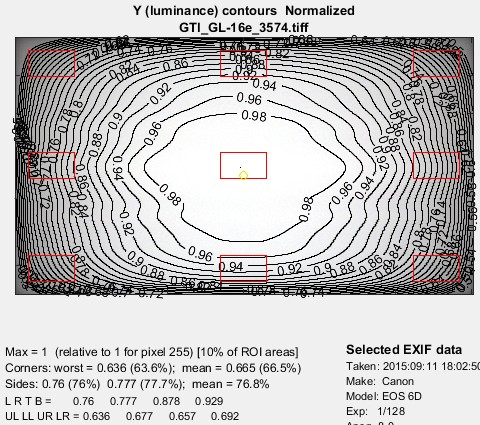 |
No longer available. We use this inexpensive lightbox for non-critical applications like MTF measurements and for trade show demonstrations. It’s uniformity is quite good. Uniformity = 77% | |
No longer available. We use this large, relatively inexpensive lightbox for non-critical applications like MTF measurements and for trade show demonstrations. It’s uniformity is quite good. Uniformity = 78.5% (Figure is darker because image was less exposed.) | 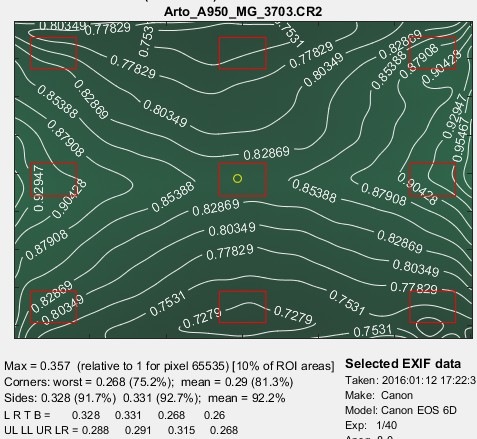 |
The controlThe control for these measurements was made by capturing images immediately in front of the ITI lightbox (no more than 1cm distant). Results were repeatable when the camera was moved around the lightbox. Contour increments are very small: only 0.002 (0.5%). Uniformity = 98.75% | 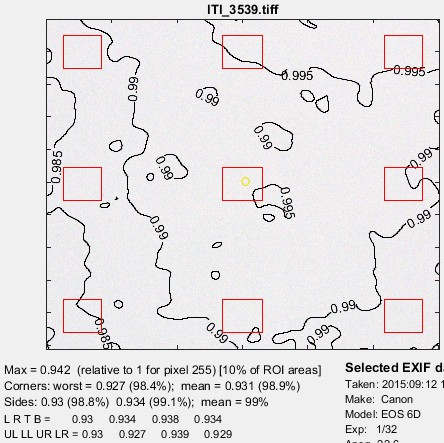 |
GTI GLX-30 Lightbox(No longer available in the Imatest Store) Uniformity = 70.1% The contour line increments are 0.02 (2%), double that of the ITI LED Lightbox. | 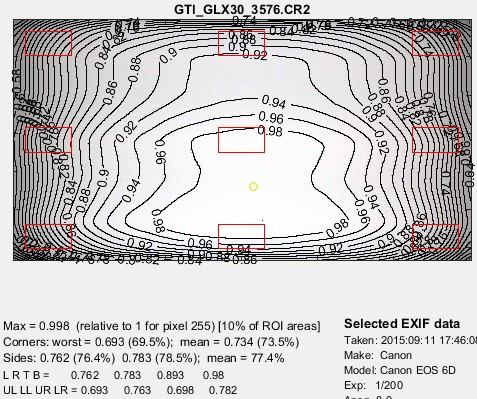 |
GTI GLE 12e Lightbox(No longer available in the Imatest Store) Uniformity = 65.8% The contour line increments are 0.02 (2%), double that of the ITI LED Lightbox. | 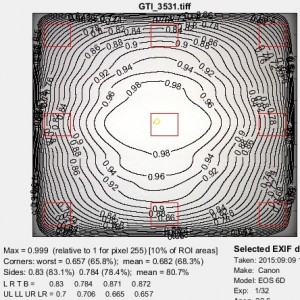 |
How we made the measurements
We developed a methodology for measuring lightbox uniformity because we were not aware of any relevant standards.
Photograph the lightbox using a mirrorless or DSLR camera with a long focal length marco lens. Such lenses tend to be highly uniform, i.e., have very low vignetting. We used the Canon EOS-6D with the highly-regarded 100mm f/2.8 macro lens set at f/8. Be sure to capture raw images. We used manual focus because the EOS-6D didn’t focus well on this image.
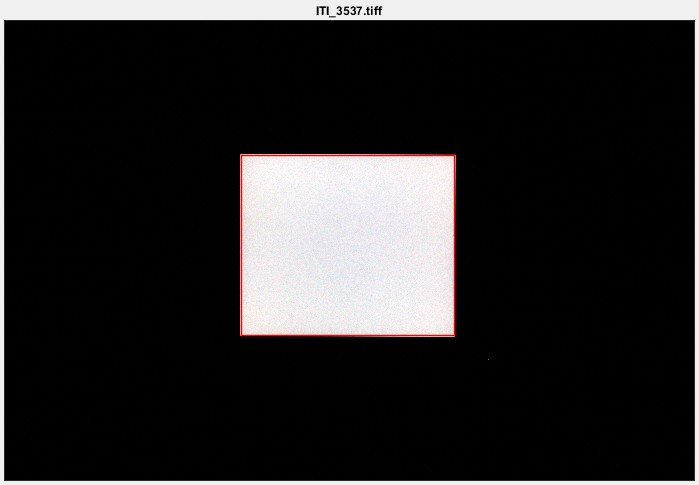
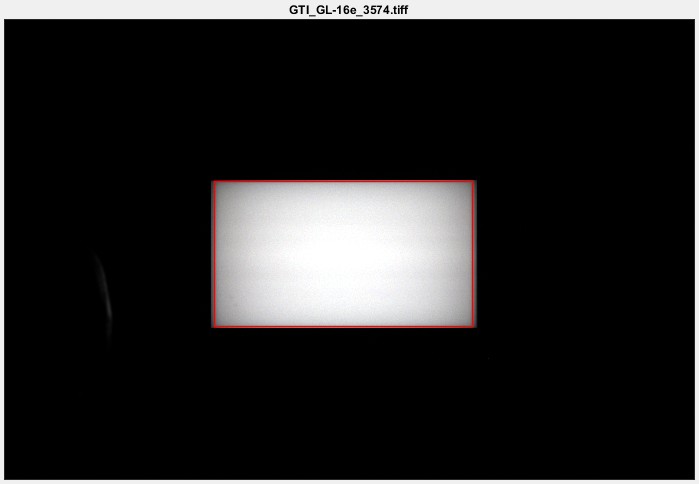
Frame the lightbox so it occupies about the central 30% of the image (10% by area). This makes the already low vignetting insignificant. Here is the framing (and region selection) for two lightboxes.
Click on the images to display them larger. | |
 |  |
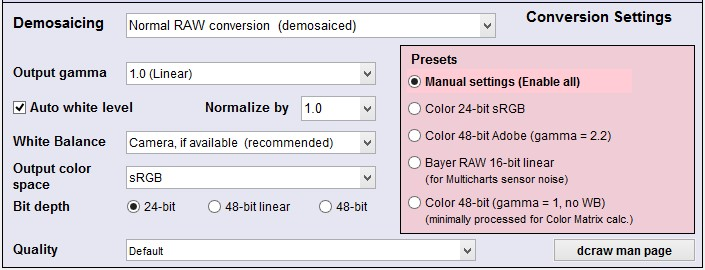
Open Flatfield (or Flatfield Interactive) and read in the raw file, converting it to a gamma = 1 (linear) file. (This means it’s not a standard color space file, but pixel level will be proportional to illumination.) Here are the recommended settings from the Imatest libraw/dcraw GUI window. The key settings are Output gamma = 1.0 (Linear), Auto white level checked, and Normalize by 1.0.
Crop the images just inside the bright areas of the lightbox, as shown above. If there are areas of rapid illumination falloff close to the edges of the lightbox image, it’s OK to omit them.
Click Yes to open the Flatfield settings box. The key settings are shown inside the red rectangles. The corner and side regions (the rectangles) are 10% of the ROI (linearly), and the location of the regions is 5% (of the ROI size) from the ROI boundaries. We feel this is a reasonable summary metric since most tone and color measurements are made in the central two-thirds of the image. Uniformity is more important when measuring tone and color than it is for MTF, even though Imatest corrects for patch nonuniformity due to vignetting and uneven illumination.
After you click OK (not shown) Flatfield runs and the results figures appear. The key nonuniformity summary metric does not appear in the figures it’s in the CSV and JSON file output. Here is the relevant CSV output.
Uniformity = 100%*(1 – (maximum of 9 squares – minimum of 9 squares) / maximum of 9 squares)
Nonuniformity LRTB sides ctr (%) | 36.44 |
Uniformity LRTB sides ctr (%) | 63.56 |
and here is the JSON output:
“nonuniformity_LRTB_sides_ctr_pct”: [36.4],
“uniformity_LRTB_sides_ctr_pct”: [63.56],