Using Babelcolor Patch Tool (discontinued) or SpectraShop
This post describes how to measure color and grayscale patches on a variety of test charts, including Imatest SFRplus and eSFR ISO charts, the X-Rite Colorchecker, ISO-15729, ISO-14524, ChromaDuMonde CDM-28R, and many more, using a spectrophotometer and one of two software packages.
Babelcolor PatchTool which works with reflective test charts.
Robin Myers SpectraShop which works with both reflective and transmissive (backlit) test charts.
Measurement results are stored in CGATS files, which can be used as reference files for grayscale and color chart analysis in Multicharts, Multitest, Colorcheck, Stepchart, and SFRplus. In many cases, custom reference files provide more accurate results than the default values.
In addition, Argyll CMS is a free, Open Source, command line-based package that can be used for a number of measurements, including illumination intensity and spectrum. See the Argyll CMS documentation for more details.
Spectrophotometer
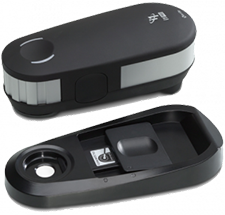
At Imatest we currently use the i1Basic Pro 3 plus (a good choice if you’re shopping for a new instrument; ). We’ll call it the i1Pro in the text below. It’s one of several instruments supported by Babelcolor PatchTool and Robin Myers SpectraShop software. The i1Pro is primarily designed for reflective readings, but it can also be used to measure transmissive (backlit) charts.
If you don’t have the original disk, Load the drivers and software from X-Rite. For our i1Pro we clicked on Software downloads (5 Items) (on this page), and loaded all relevant software. For the i1Basic Pro 2, go to this page.
Install the drivers for your system and i1Diagnostics. Run i1Diagnostics to make sure your hardware is functioning properly.
The other programs for the i1Pro are useful for purposes such as monitor calibration, but not directly relevant to chart calibration/patch measurement.
Babelcolor Patch Tool (free)
Read the description of PatchTool on the Babelcolor page, then download and install it. You’ll need to purchase it in order to run Patch-Reader (no luck with evaluation mode). Registration is straightforward (no special instructions needed).
Open PatchTool. The window is very simple— not much to it.
Click Tools, Patch-Reader… to open the Patch-Reader…
Select the Chat type. Click Custom chart for rectangular grid charts (like the X-Rite Colorchecker), and select the correct number of rows and columns. The default is 4 rows, 6 columns (for the Colorchecker). Select 4 rows, 5 columns for SFRplus color and grayscale charts. Unconstrained measurements work perfectly well for rectangular grid charts and must be used for charts that don’t have a regular rectangular grid (like the ISO-15739, CDM-28R, etc.). The Patch-Reader window will look like this.
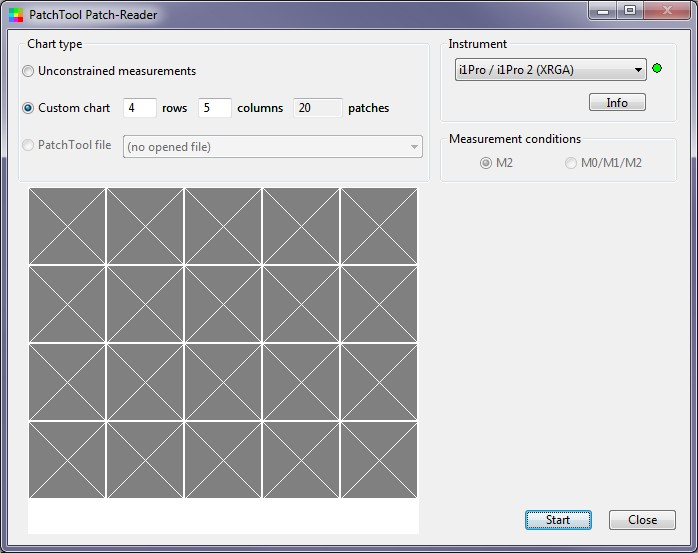
Press Start. A window opens with the following message for calibrating the spectrophotometer. Follow instructions and press OK .
REFLECTANCE CALIBRATION: Remove the AMBIENT DIFFUSER if installed. Place the i1Pro on its BASE (white tile). When ready, press the ‘Return’ or ‘Enter’ keys or close this message window.NOTE: This calibration may take several seconds! OK |
After you finish the calibration, Read and Stop buttons appear on the lower-right of the Patch-Reader window.
Place the i1Pro on the first patch of the chart and click the button on the side. This is equivalent to pressing Read (which should never be necessary).
Now go through the patches one-by-one, by rows (for rectangular charts). For non-rectangular charts you’ll need to know the patch order, which is described below. For rectangular grid charts the Patch-Reader window will displays the location of the next patch to measure. Be sure to position the i1Pro carefully over the center of the patch and press it firmly against the target to minimize stray light. (Subdued room light doesn’t hurt.) (For a m row x n column chart, the order is Row 1-Col 1, Row 1-Col 2, … Row 1-Col m, Row 2-Col 1, etc.)
A little inconsistency Although you enter patches by rows (R1C1, R1C2, …, R1Cn, R2C1, … R2Cn, …) at Patch-Reader’s prompting, the patches in CGATS files (created using Custom chart: m rows x n columns) are stored by columns: (R1C1,R2C1, …, RmC1, R1C2, …, RmC2, …). This is NOT consistent with CSV files, which are stored by patch order, i.e., rows (R1C1, R2C2, …R1Cn, R2C1, … R2Cn, … for rectangular charts). Imatest recognizes the file type (CSV or CGATS) and interprets the patch order correctly (using the LGOROWLENGTH setting in CGATS files). |
You can use the mouse to select a patch to measure, i.e., you can go back and re-measure if you have any doubts about measurement quality.
When you have finished the Patch-Reader window will look like this. You should examine this image carefully to be sure it resembles the chart— all patches should look correct: You can still select patches to re-measure if necessary.
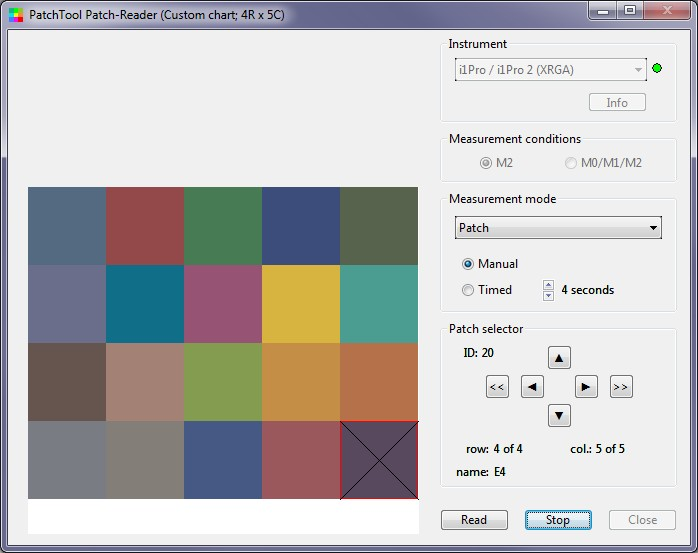
Click Stop, and the a window appears with the following options.
Do you want to Save these measurements? Click ‘Cancel’ to continue making measurements. Save Discard Cancel |
When you click Save, the following window appears. For typical Imatest use, only the L*a*b* data field needs to be checked. ID (SAMPLE_ID; the numeric sequence) and Name (SAMPLE_NAME; The alpha column and numeric row, i.e., A1, …, A4, B1, …, F4) may be checked, but will be ignored by Imatest. XYZ and xyY may be checked, but will be ignored if L*a*b* is checked. (The order of precedence in reading data is L*a*b*, XYZ, then xyY.)
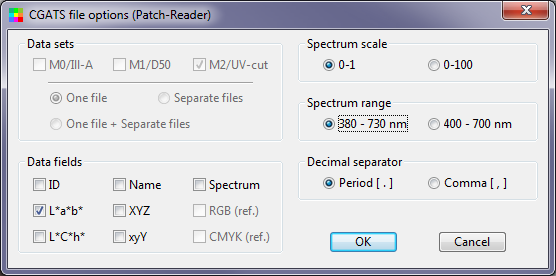
The save file name should include the media type (matte, luster, …) and any other information needed to identify the chart.
PatchTool writes files in CGATS format (an industry standard best explained in the PatchTool Help PDF document). Imatest can read CGATS file. Here is an example:
CGATS.17
ORIGINATOR    "BabelColor PatchTool, version 4.1.0 b321"
LGOROWLENGTH    4
CREATED    "2013-07-01"  # Time: 1:25:46 PM
INSTRUMENTATION    "i1Pro"
INSTRUMENT_SN    "608994"
MEASUREMENT_SOURCE    "Illumination=D50 ObserverAngle=2 WhiteBase=Abs Filter=UVcut"
ILLUMINATION_NAME    "D50"
OBSERVER_ANGLE    "2"
FILTER    "UVcut"
MEASUREMENT_CONDITION    "M2"
WEIGHTING_FUNCTION    "ILLUMINANT, D50"
WEIGHTING_FUNCTION    "OBSERVER, 2 degree"
KEYWORD    "DEVCALSTD"
DEVCALSTD    "XRGA"
#
# THIS FILE CONTAINS REFLECTANCE MEASUREMENTS MADE WITH PatchTool Patch-Reader
#
# Chart_type: "Custom chart"
# No_rows: 4
# No_columns: 5
# No_samples: 20
#
NUMBER_OF_FIELDS    3
BEGIN_DATA_FORMAT
LAB_L    LAB_A    LAB_B
END_DATA_FORMAT
NUMBER_OF_SETS    20
BEGIN_DATA
44.050    -4.479    -15.534
46.989    3.638    -16.591
38.129    6.395    6.321
52.539    -0.730    -3.700
40.766    32.354    14.498
42.772    -19.174    -21.994
57.309    12.668    12.012
53.507    1.771    3.460
47.533    -25.359    16.443
44.629    32.242    -6.113
61.667    -18.258    37.479
37.817    2.403    -27.741
33.075    4.416    -29.699
75.079    4.192    62.638
63.637    15.573    46.478
45.767    28.423    10.312
41.007    -8.057    10.701
59.762    -28.214    -1.841
55.213    23.810    34.126
33.661    10.341    -10.492
END_DATA
SpectraShop
Download and purchase SpectraShop (SpectraShop 6 as of mid-2024; the instructions here were developed using SpectraShop 4) using links at the bottom the product description page. Both Windows and Mac versions are available. The brief Tutorials are recommended. You should also download the full PDF manual and look at the FAQ, which has troubleshooting information. Open SpectraShop. Click on the Measure specimens box, which is the second from the left. (I’ve tried Create and edit charts and Measure chart without luck.)
 This opens the Instrument Connection window, shown on the right. Select the spectrophotometer, click Connect, select the Specimen Type (reflective, transmissive, etc.). Be sure the spectrophotometer is on its base (with white tile), then press Calibrate. Instrument Connection window, shown just before Calibration | 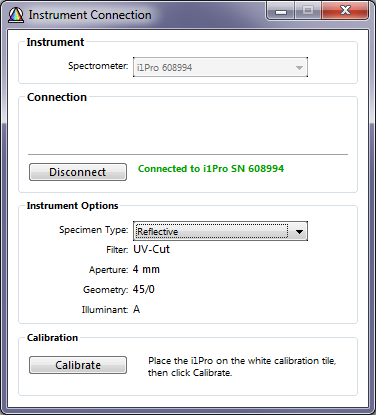 |
After Calibration is complete, the Measure Reflective Specimens page will open. None of the settings are critical, but we recommend
When you have finished making settings, press Start. Place the spectrophotometer sensor over the patch. If possible the room should be dimly lit to minimize light leakage. Take each reading by clicking the spectrophotometer button— waiting about two seconds for a beep indicating that the reading is complete. Patch order is described below. Take readings carefully. I haven’t (yet) found a convenient way to edit or redo erroneous readings. Saving the reference fileI recommend saving results in two formats: the default SpectraShop ss3 format (not interchangeable, but can be reopened in Spectrashop), which contains all results (including the spectrum), and CGATS with just the results used by Imatest. To save the SS3 file, click (in the window shown below) File, Save… or Save as… The procedure for saving Imatest-readable CGATS files is shown below. | 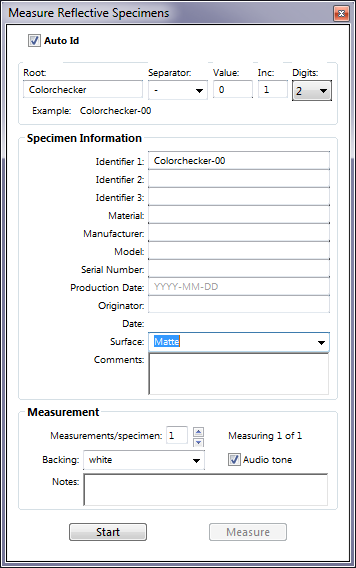 |
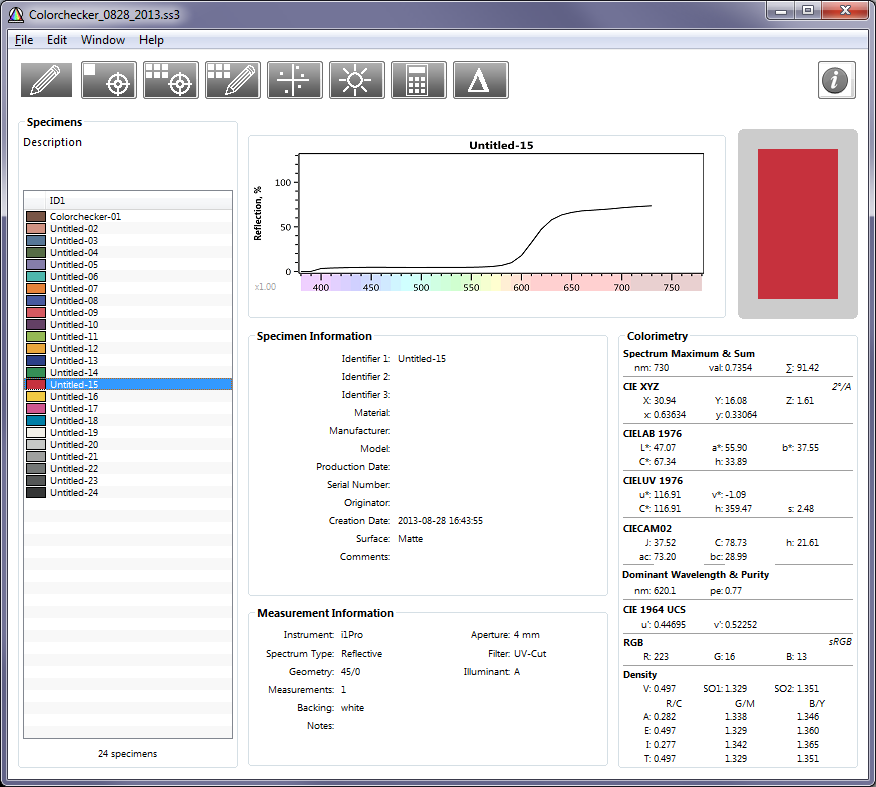
To save the measurements in an Imatest-readable CGATS file, click File, Export… The window on the right opens. Select CGATS 1.7 ASCII as the Export Format. Spectrum should be unchecked and L*a*b* should be checked. XYZ and xyY may be checked if desired, but they will be ignored by Imatest if L*a*b* has been checked. Spectrashop Export window Here are the results: |
CGATS.17
ORIGINATOR    ""
CREATED    "2013-08-28 16:43:55"
INSTRUMENTATION    "i1Pro"
MEASUREMENT_GEOMETRY    "45/0"
MEASUREMENT_SOURCE    "A"
WEIGHTING_FUNCTION    "OBSERVER,2 degree"
WEIGHTING_FUNCTION    "ILLUMINANT,A"
NUMBER_OF_FIELDS    4
BEGIN_DATA_FORMAT
SAMPLE_ID    LAB_L    LAB_A    LAB_B
END_DATA_FORMAT
NUMBER_OF_SETS    24
BEGIN_DATA
"Colorchecker-01"    39.80    14.43    17.09
"Untitled-02"    67.86    22.51    20.21
"Untitled-03"    48.51    -9.36    -23.27
"Untitled-04"    43.04    -10.81    20.67
"Untitled-05"    54.88    5.55    -24.67
"Untitled-06"    68.04    -32.15    -6.00
"Untitled-07"    66.70    34.88    63.83
"Untitled-08"    38.48    -0.44    -45.06
"Untitled-09"    56.15    47.12    25.25
"Untitled-10"    31.91    17.66    -16.69
"Untitled-11"    71.40    -16.98    50.80
"Untitled-12"    74.84    21.00    71.57
"Untitled-13"    27.04    0.66    -49.03
"Untitled-14"    52.88    -32.25    23.97
"Untitled-15"    47.07    55.90    37.55
"Untitled-16"    83.99    9.76    78.29
"Untitled-17"    55.75    47.38    -5.30
"Untitled-18"    47.53    -31.32    -35.23
"Untitled-19"    95.01    0.32    4.03
"Untitled-20"    80.78    -0.72    0.38
"Untitled-21"    66.36    -0.71    0.28
"Untitled-22"    49.81    -1.43    -0.39
"Untitled-23"    36.00    -0.85    -0.45
"Untitled-24"    20.92    -0.34    -0.53
END_DATA
Patch order
Charts with a regular m x n rectangular grid have patches numbered in a sequence shown in the example below for the 4 row X 6 column X-Rite Colorchecker. Use this order in acquiring patch data.
1 | 2 | 3 | 4 | 5 | 6 |
7 | 8 | 9 | 10 | 11 | 12 |
13 | 14 | 15 | 16 | 17 | 18 |
19 | 20 | 21 | 22 | 23 | 24 |
Several grayscale charts (ISO-15739, etc.) that don’t have regular m x n grids have their patch order listed in Special and ISO Charts. These charts are supported by Multicharts.
Patch order for charts supported by Multicharts can be displayed by running Multicharts, selecting 3. Split Colors: Reference/Input (in Display), then checking the Numbers checkbox. Here are the patch numbers for the DSC Labs CDM-28R.
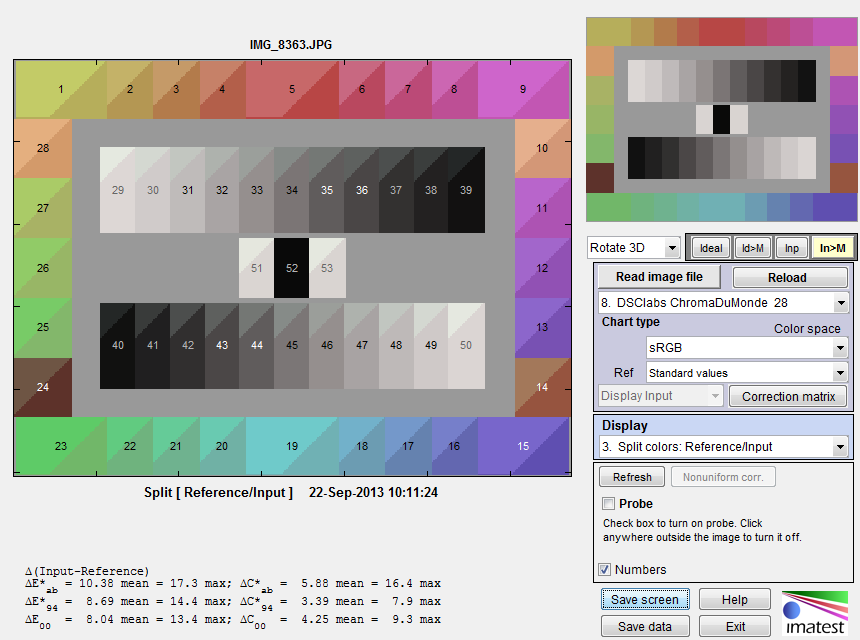
There are a few special cases, such as the Rezchecker (a tiny precision reflective chart for measuring color, tones, and MTF). The numbering follows the standard rectangular grid, but corner patches and patches used for slanted-edge MTF have L* = a* = b* = 0 in their reference file, and are omitted from color analysis. For the Rezchecker these include patches 1, 6, 8-11, 14-17, 37, and 42. | 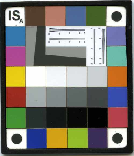 | 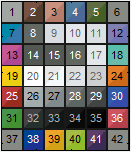 |
Some cases are not obvious, like the eSFR ISO color patches, which are supported by Multicharts, but usually run in eSFR ISO. eSFR ISO color patches | 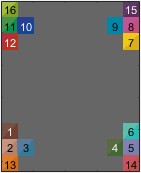 | |
See Also
i1Basic Pro UVcut – predecessor to the i1Basic Pro2