Deprecated in Current Release
PostProcessor to Spatial Frequency Response (SFR) Slanted Edge Chart:
Calculates AutoFocus Consistency of a Digital Cameras using a Slanted Edge Image
| Standard: | ISO/NP 20490 Measuring Auto-Focus Performance of a Digital Camera |
| Technical Committee: | ISO/TC 42 Photography |
| Published: | 2016-06-02 |
Introduction to the AutoFocus postprocessor
Imatest 4.5-5.1 can measure Autofocus repeatability of a digital still camera by using Imatest's SFR module. This module was deprecated in Imatest 5.2 since the ISO standard for Autofocus was postponed.
A method to measure the Autofocus Consistency performance of a digital still camera for both continuous and camera requiring focusing just before capture covered in Imatest's AutoFocus Consistency postprocessor module. To test the AF Consistency of a device, capture several images at several different positions. The process of choosing positions for the camera is to first create a set of positions that the camera refocus each time when the camera moved between positions. Use Imatest's Autofocus test chart or any of the slanted edge test chart to capture test images and measure MTF50 values in cycles per pixel using the slanted edge modules(SFR) by saving the .json files.
Optimal Distances (Camera Position) :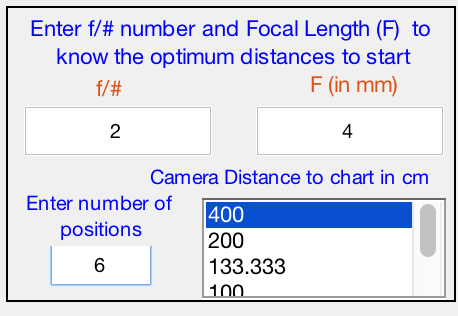
- Camera positions to capture test images is fully depend on the device under test.
- Calculation of Hyper Focal Distance (H) and related positions depend on Camera f/#-number, Focal length (F) and Circle of Confusion (CoC).
- For now the calculations assumes a CoC of 2 microns which is optimal for cell phone camera and in future this will be user-settable.
Operation:
- Capture several images of a test chart at a particular distance, the optimum distance to start with would be hyper focal distance.
- Repeat same procedure for several set of distances( Hyper focus to Macro focus). The recommended number of distances would be 5 to 6.
- Analyze the images with SFR module.
- Specify the distance related to the set of images to be run and be sure to save the .json output file.
- Open SFR by clicking on the top left corner of the Imatest main window and select specific set of images related to a specific distance. The following screen will appear and make sure you select read separate files and hit yes.
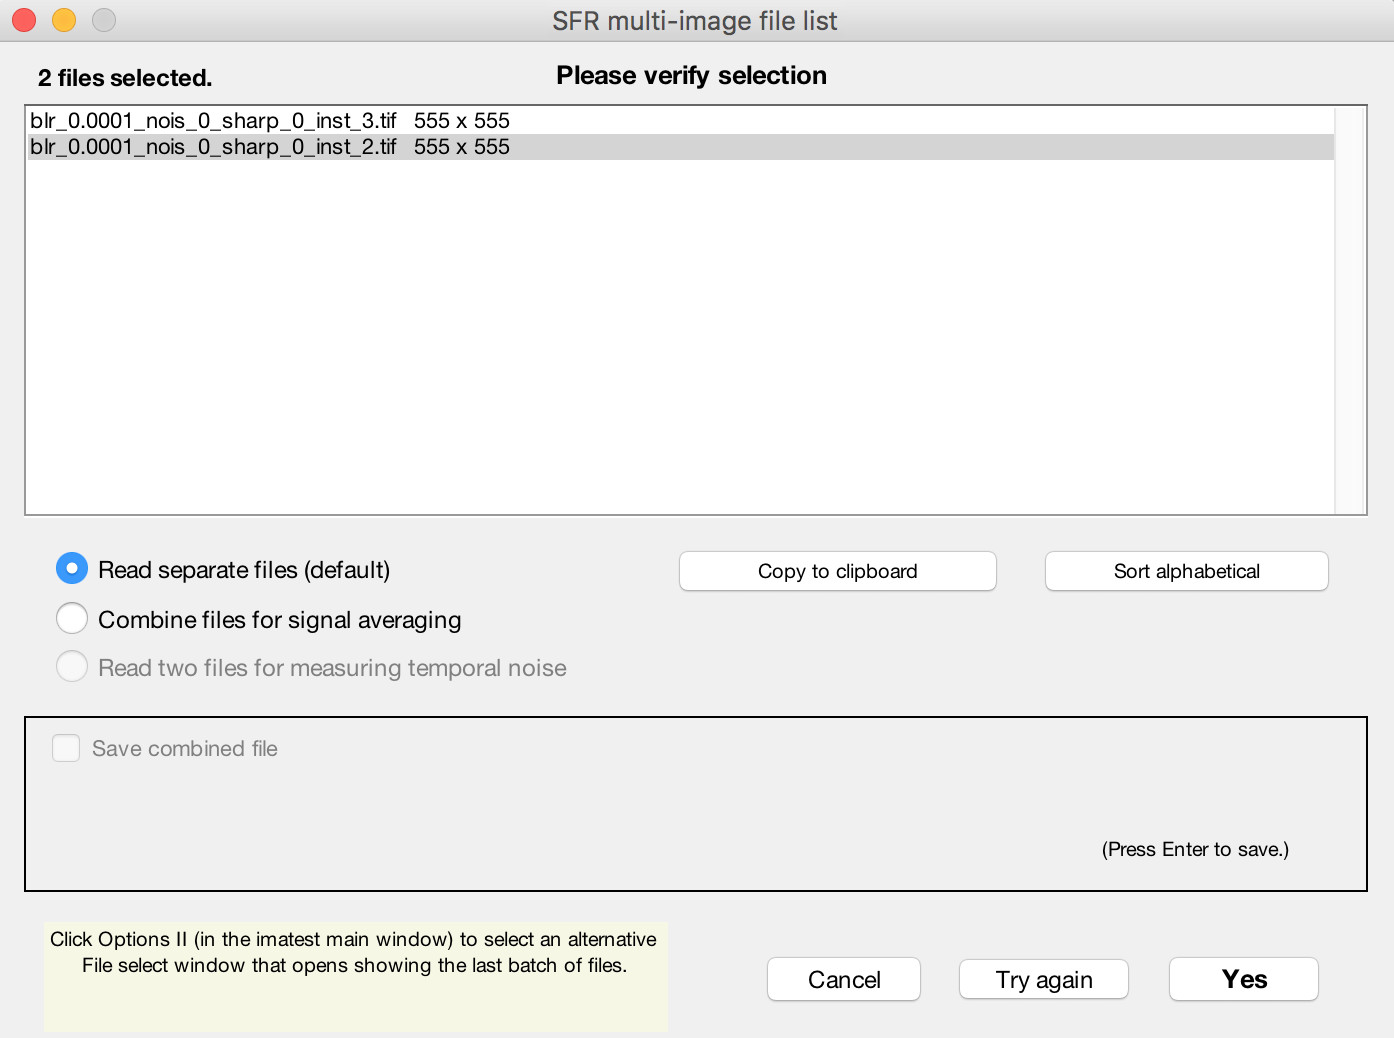
- Select a wide enough slanted edge region and continue, then the following screen will appear. Enter the distance related to the images in "Lens-to-chart distance cm" box.
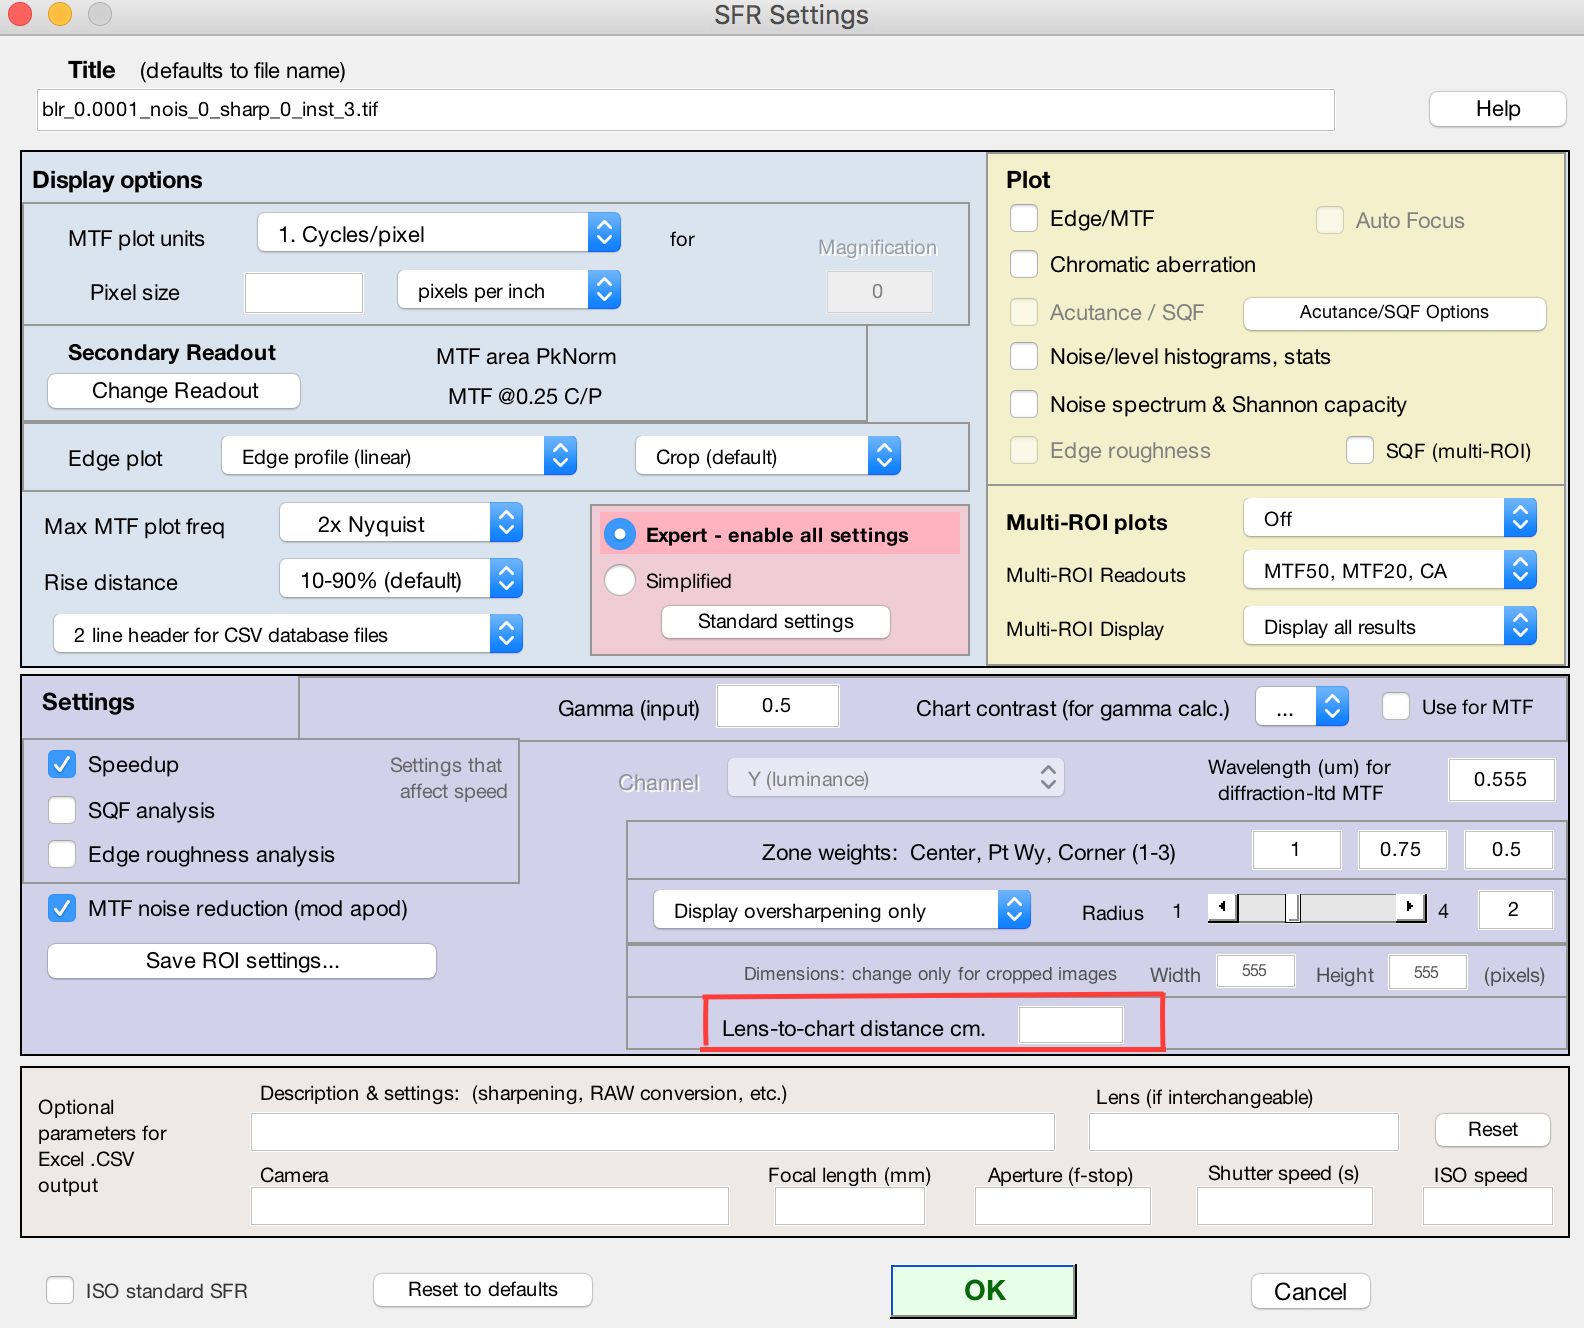
- Run analysis and be sure to save the output file in .json format in Results folder.
AutoFocus PostProcessor Operation:
- Open Imatest and click on Interactive/Postprocessor then you will see Autofocus Consistency module in the drop down menu list. Click on that module then the following screen will appear.
- Click on "Select Files" box to load all .json output files to measure the Autofocus Consistency analysis.
- If the "lens-to-chart distances" variable is not empty in the .json files then those file will be sorted based on distances, and listed in "Selected files for Analysis" listbox in descending order. Example "6 files @ (90cm)".
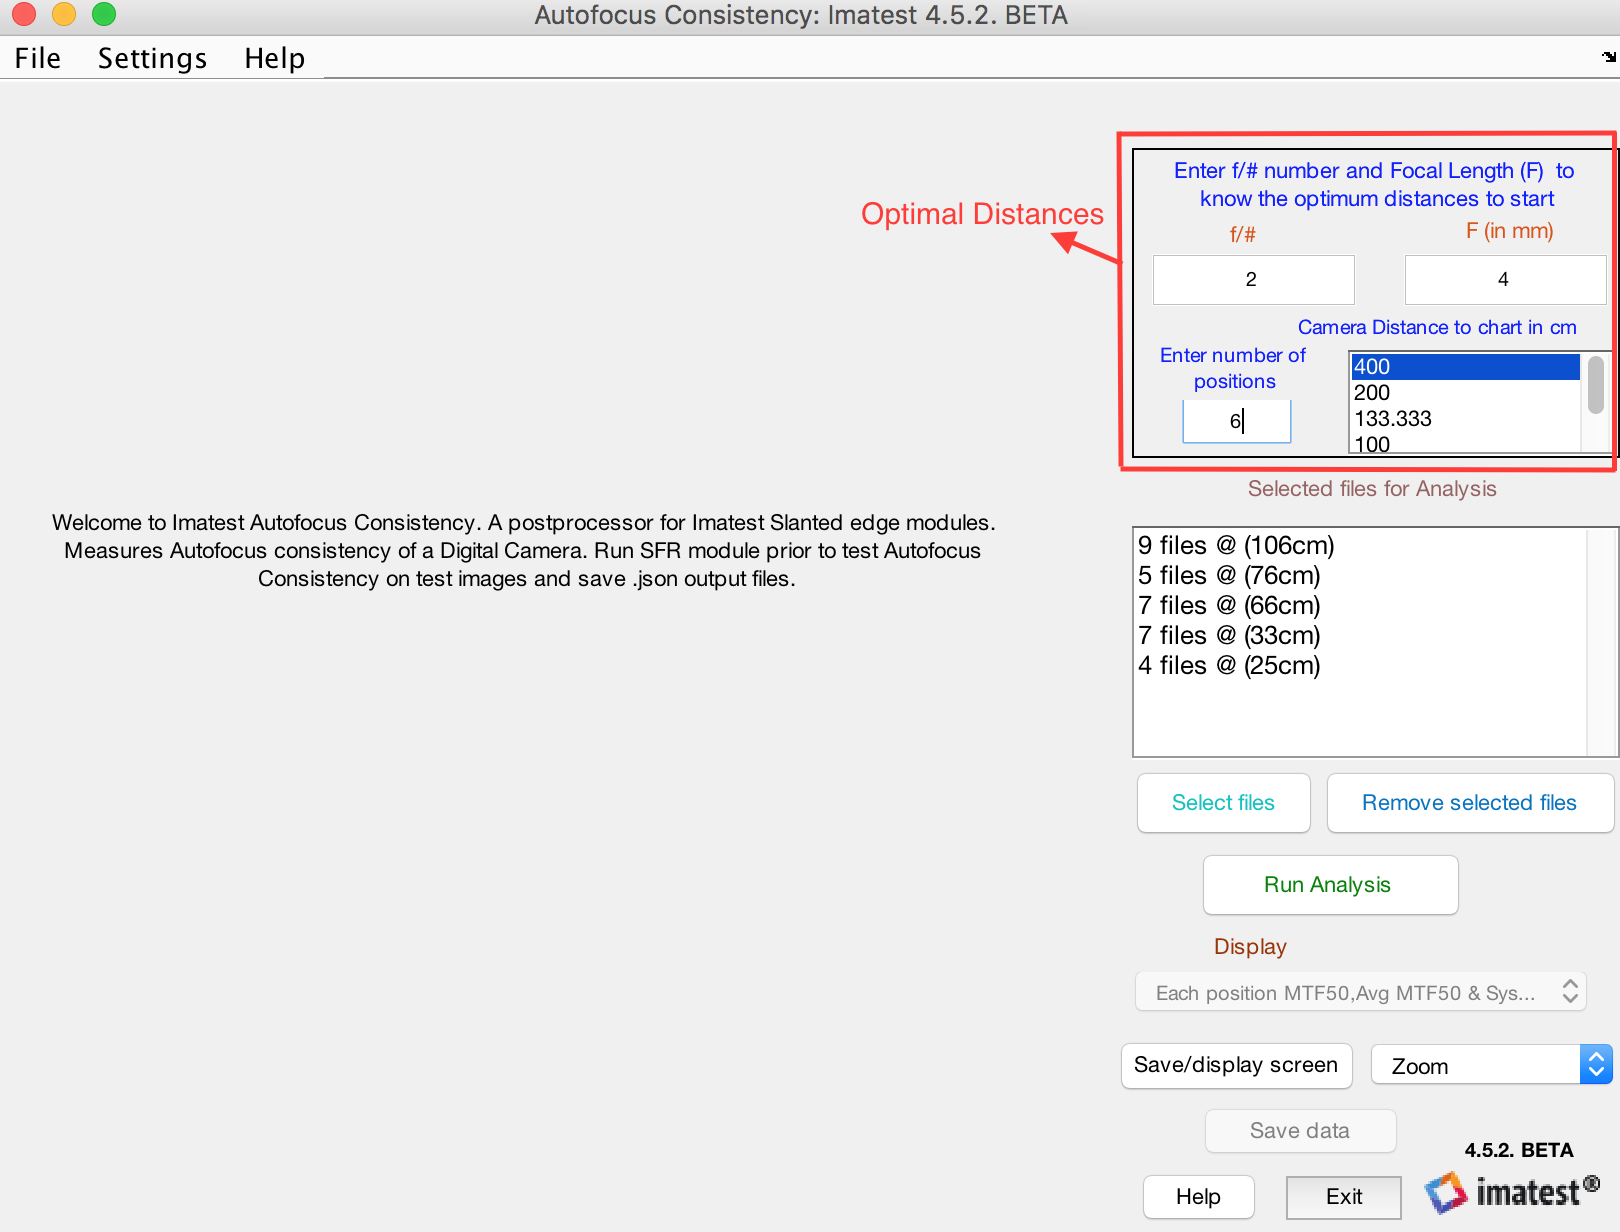
- If the "lens-to-chart distances" variable is empty in the .json files then those files will be sent out to "file classification window" and displayed in "files lacking distance info" listbox as shown below.
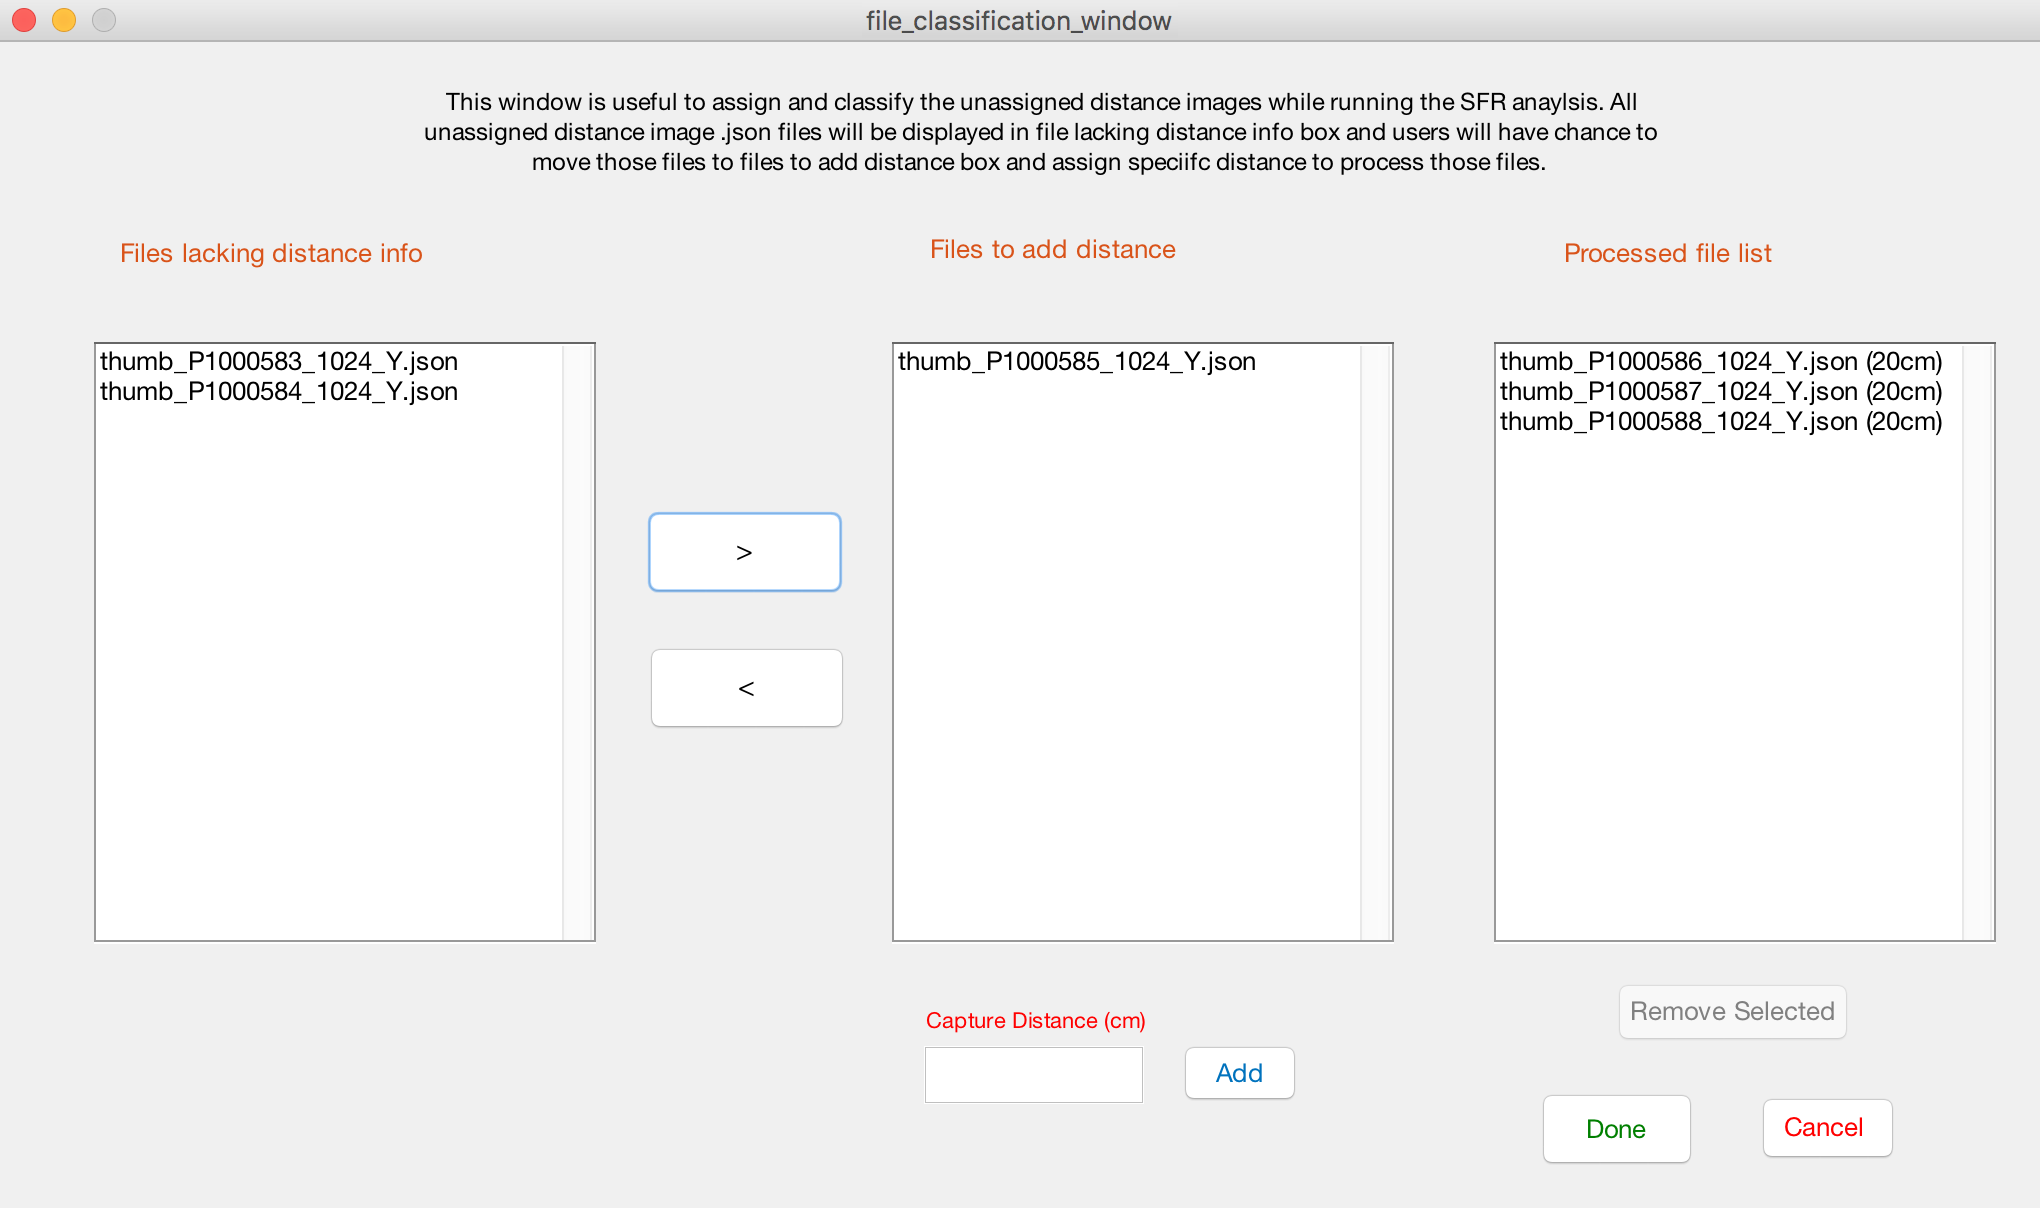
- Select and transfer files from "files lacking distance info" to "files to add distance" listbox to assign a missed distance information.
- Enter a specific distance in "Capture Distance" box to assign missed distance to those files and press "Add" button to send those files to "Processed file list".
- "Remove Selected" button will send back the selected file from "Processed file list" to "files lacking distance info"
- "Done" button collects all files existing in "Processed file list" according to the sorted distance and send back to the "Autofocus repeatability analysis" window and displays in "Selected files for Analysis" listbox. If same distance files exists in "Selected files for Analysis" listbox then the new distance files will append to those existing files.
- "Cancel" will do nothing and closes the "File classification window".
- Click on "Run Analysis" button to analyze the Auto Focus Repeatability process on existing files.
Results
Several display(plots) options are available. They are selected in the lower-right region of the "Autofocus repeatability analysis" window.
| Display(plots) |
| Image MTF50, Position Mean MTF50 and Overall Mean MTF50 |
| Histogram Distribution of MTF50. |
| Box plot Distribution of MTF50. |
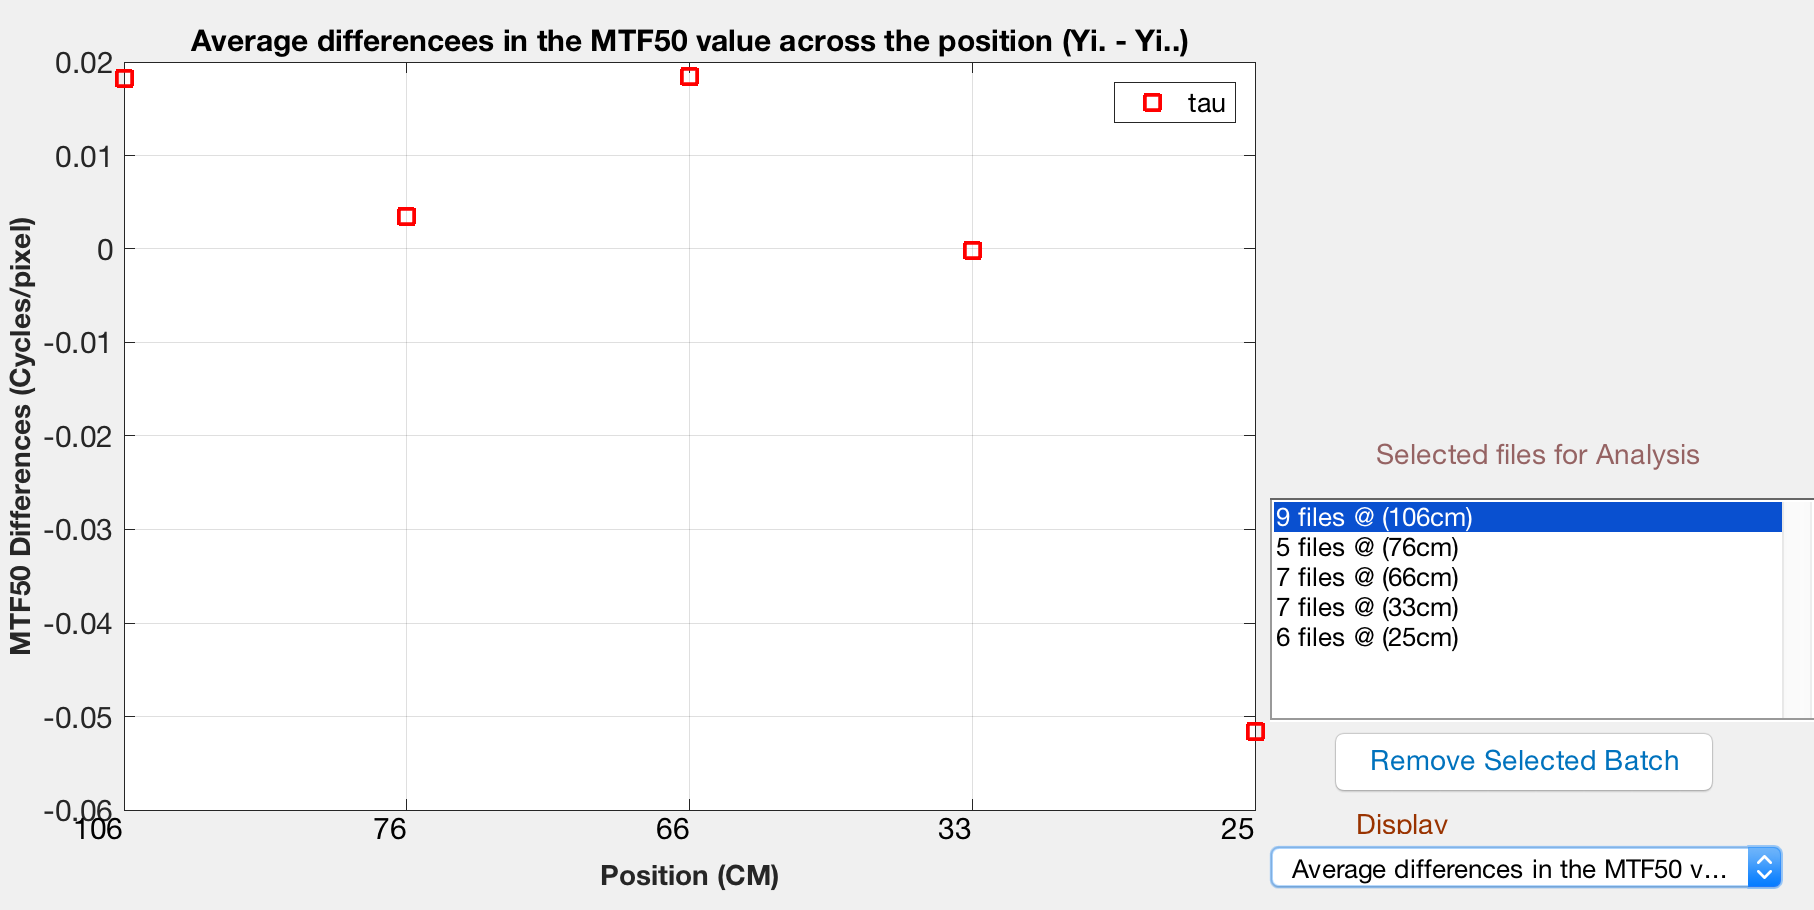
The image below shows Difference between each position Average MTF50 versus overall system Average MTF50. The x-axis shows number of positions (Distance in CM) and y-axis shows the MTF50 Difference distribution along each position in Cycles/pixel. If any of the image is not well focused that image exhibits a different MTF50 values compared to others. For example from position 1 to 4 the images shows a consistent behavior compared to 5th position where there is a drop in MTF50 difference because the camera is very closer to the target.
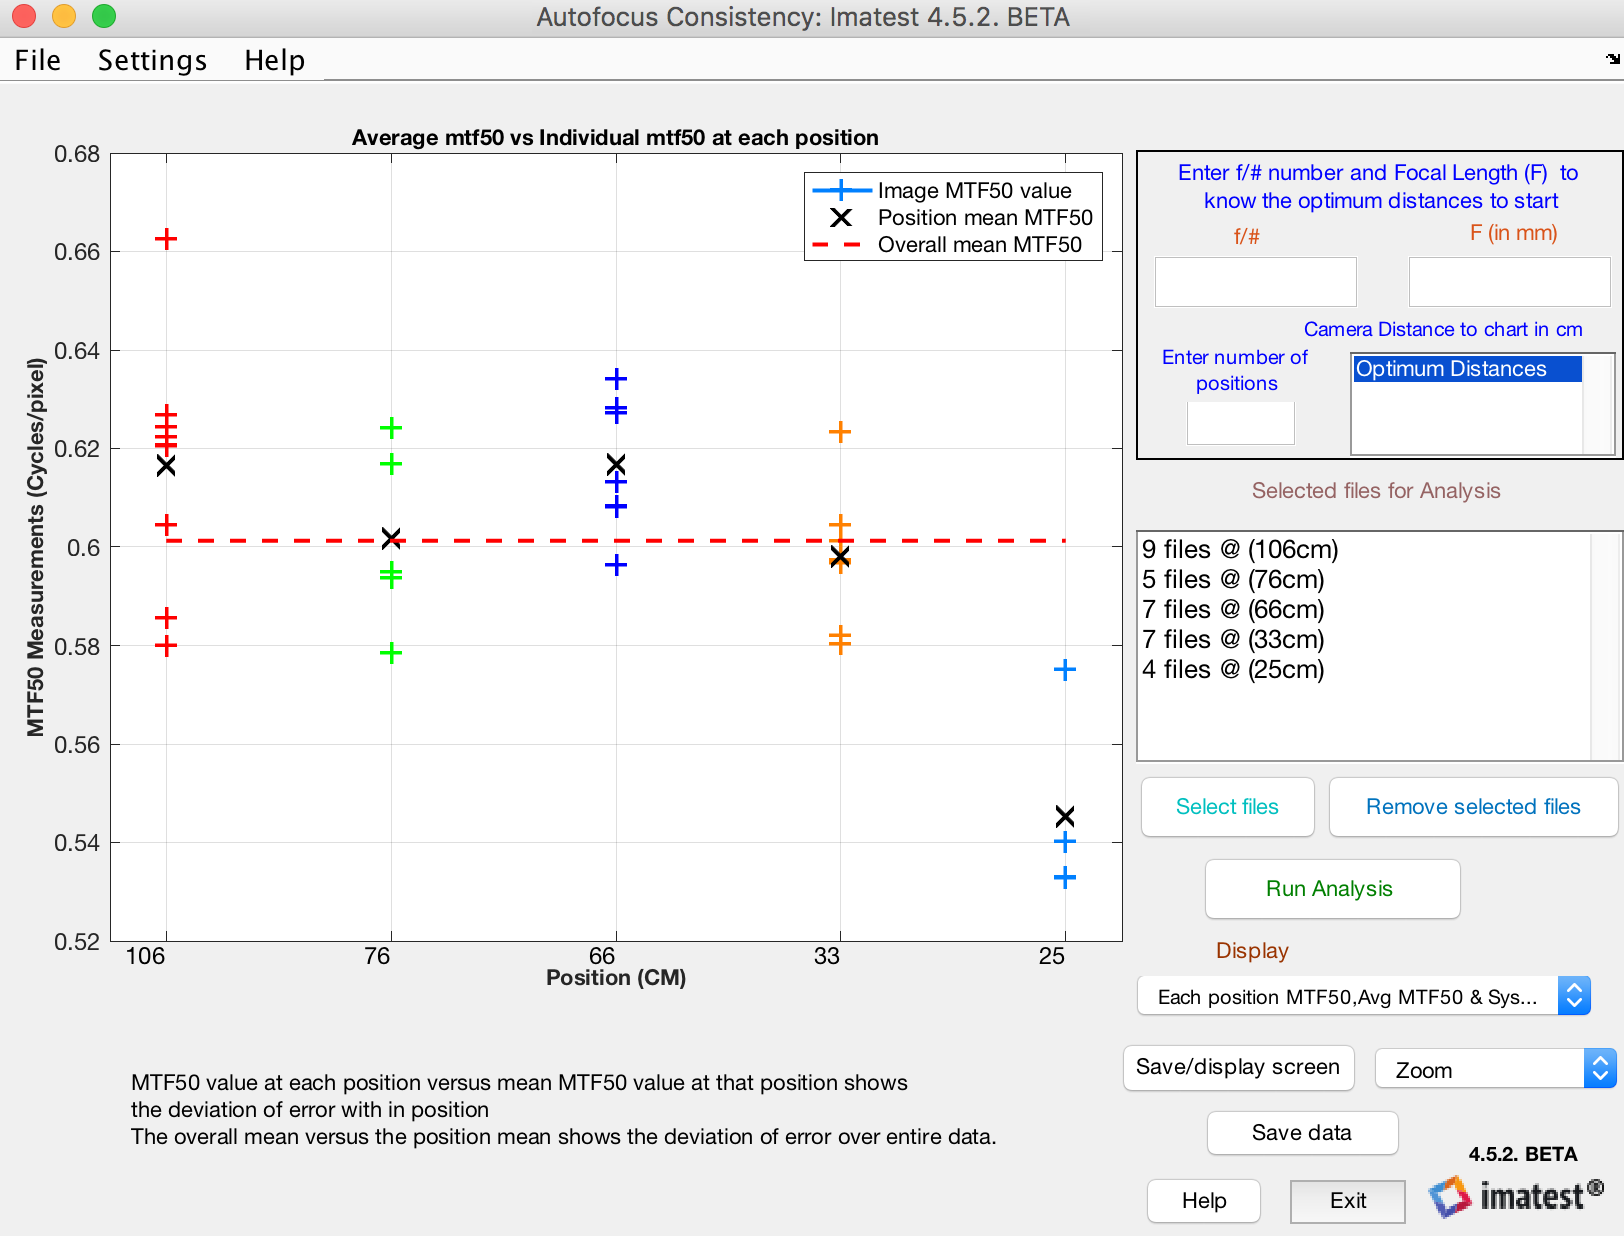
Several other plots are shown below to give you an idea on how MTF50 values is distributed across positions.
Histogram Representation:
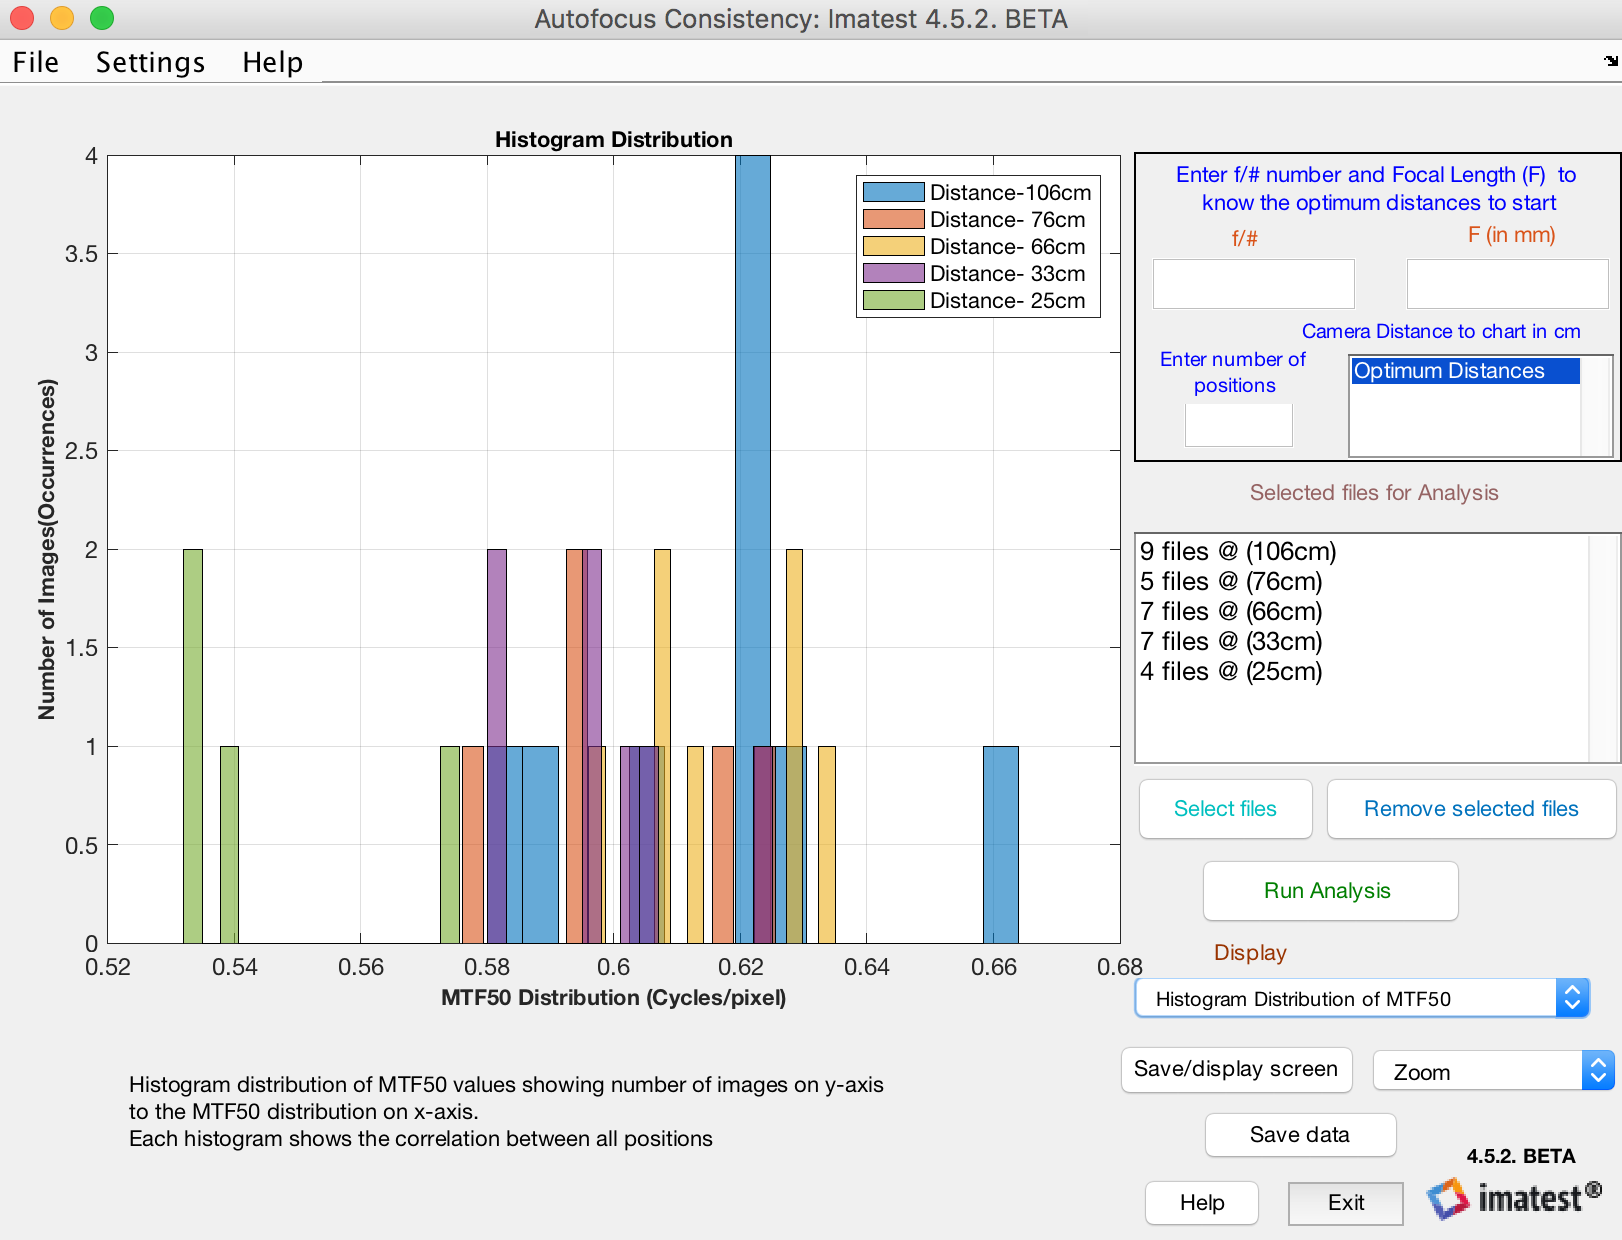
Out of 32 images across all positions, the images are showing a consistent behavior in all 4 cases where the target is not too close to the camera and the target which is closer to the camera shows a different behavior in MTF results.
Box Distribution:
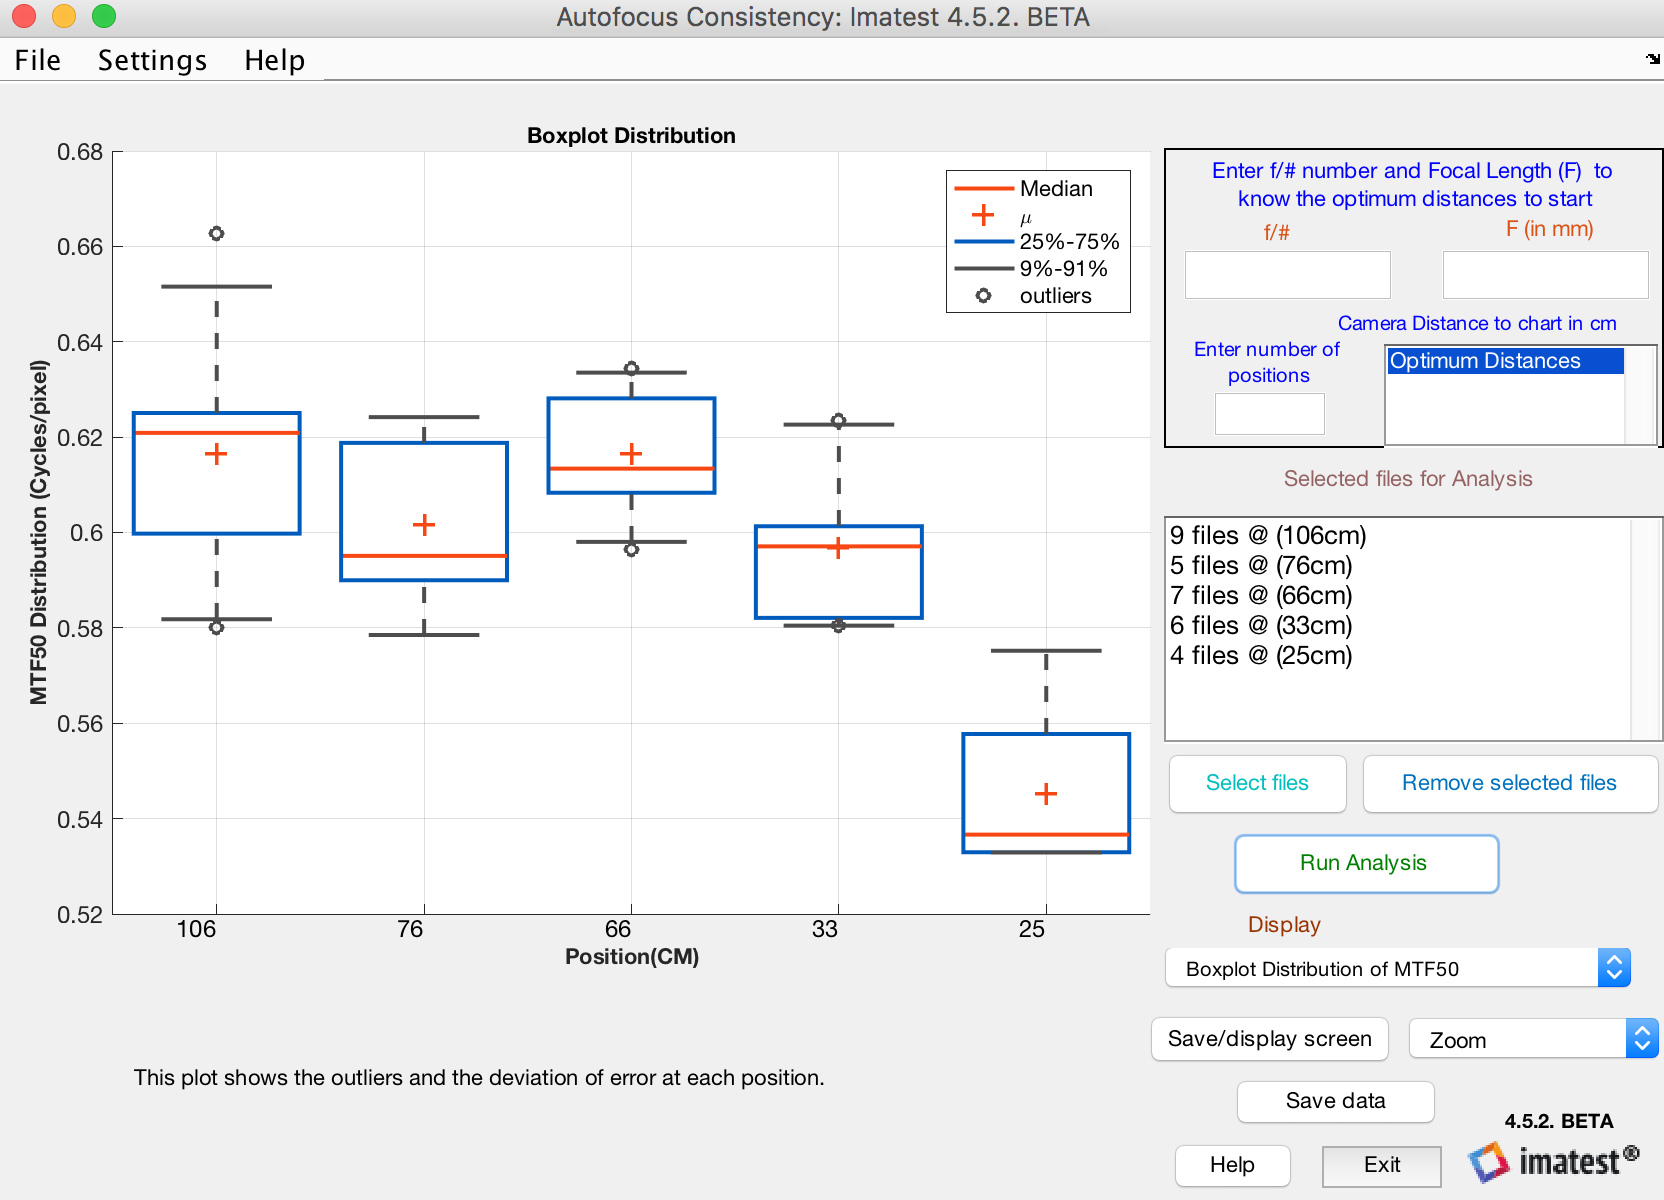
The above plot shows the over all system Mean, Median and the outliers MTF50 values in a single plot.