For users of MATLAB's esfrChart class, please click here.
Two operating modes - Charts - ISO 12233:2017 Compliance - Advantages -
Lighting - Distance - Exposure - Links
Imatest eSFR ISO performs highly automated measurements of several key image quality factors using versions of the ISO 12233:2017 E-SFR (Edge SFR) and new ISO 12233:2023 E-SFR test charts that may be purchased from the Imatest store (recommended) or printed on a high-quality inkjet printer. Region of Interest (ROI) selection is automatic, based on user-entered criteria (similar to SFRplus, which it closely resembles). Image quality factors include:
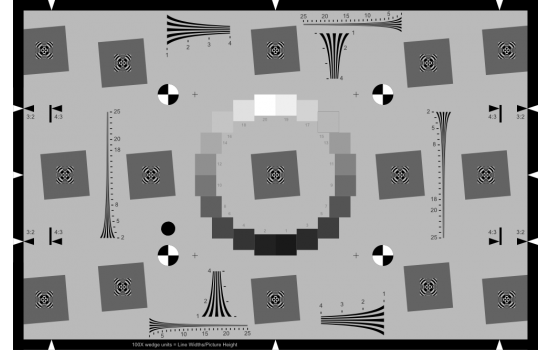
- Sharpness, expressed as Spatial Frequency Response (SFR), also known as Modulation Transfer Function (MTF)
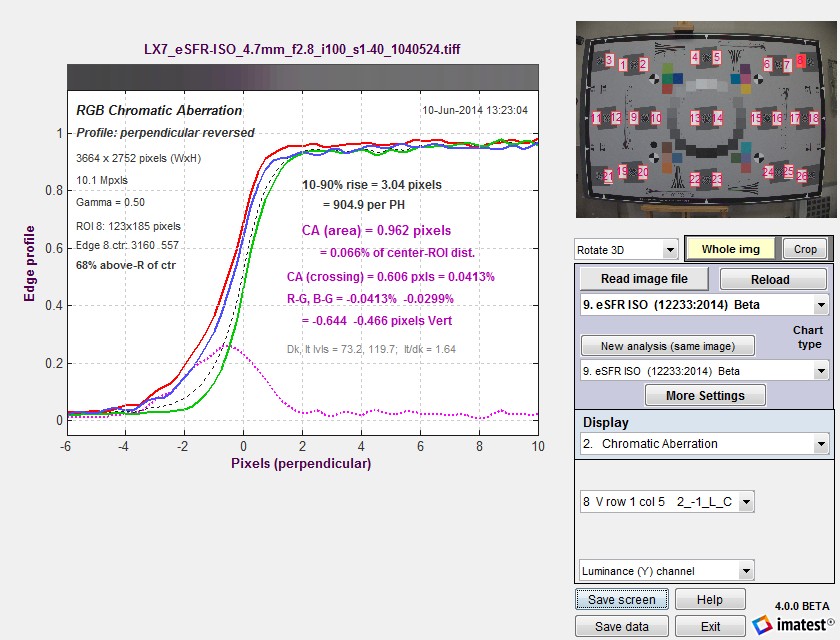
- Lateral Chromatic Aberration
- Distortion Simple low-order calculations; less accurate than the SFRplus or Checkerboard). Modules are compared in Distortion: methods and modules.
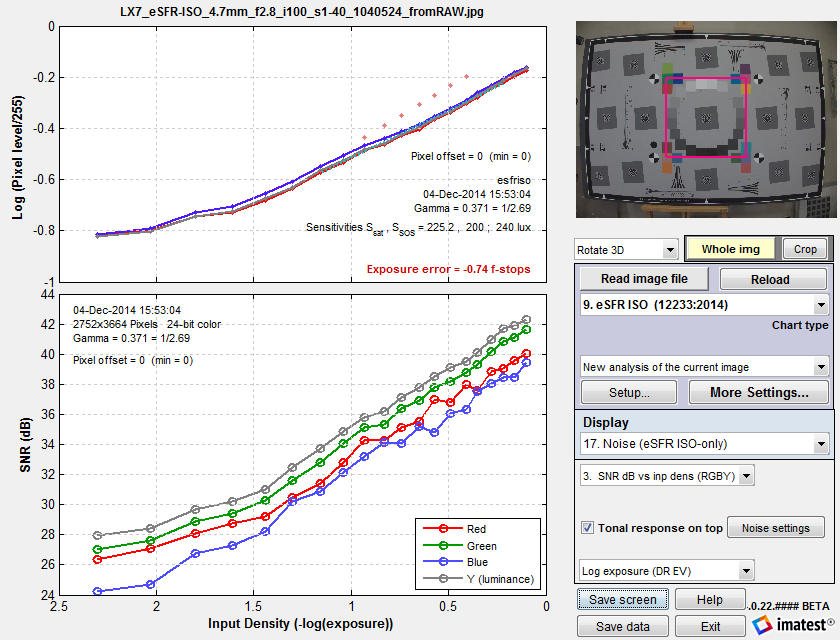
- Noise, measured from the grayscale patches surrounding the center of the chart, includes all types of noise calculated by Color/Tone Interactive and Color/Tone Auto (standard pixel noise, chroma noise, scene-referenced noise, sensor (raw) noise, and ISO-15739 visual noise and dynamic range). SNR (Signal-to-Noise Ratio) can also be displayed as a ratio or in dB.
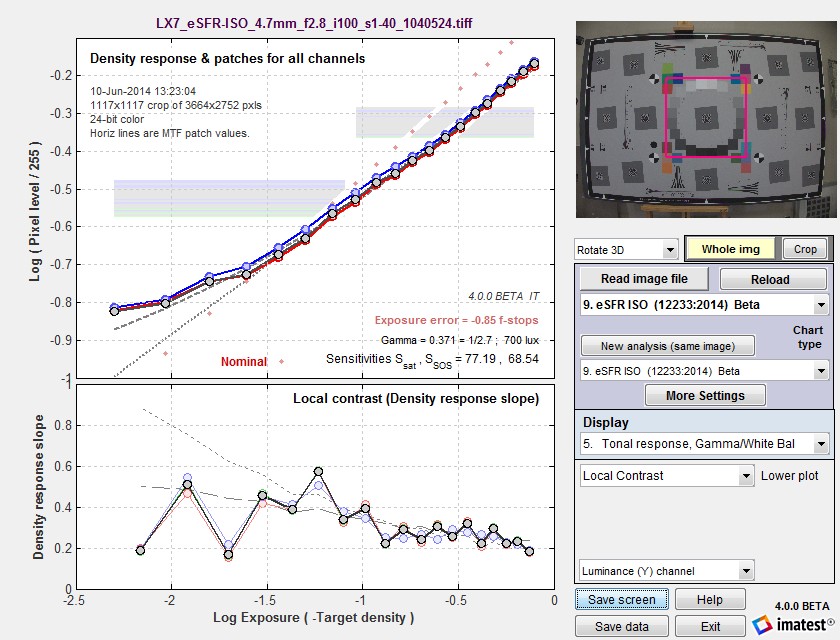
- Tonal response (also from the grayscale patches).
- Color accuracy, when used with an eSFR ISO chart that contains the optional color pattern (available in all inkjet and color film LVT charts, but not in B&W photographic charts), near the grayscale patches.
- ISO sensitivity (Saturation-based and Standard Output Sensitivity), when incident lux is entered.
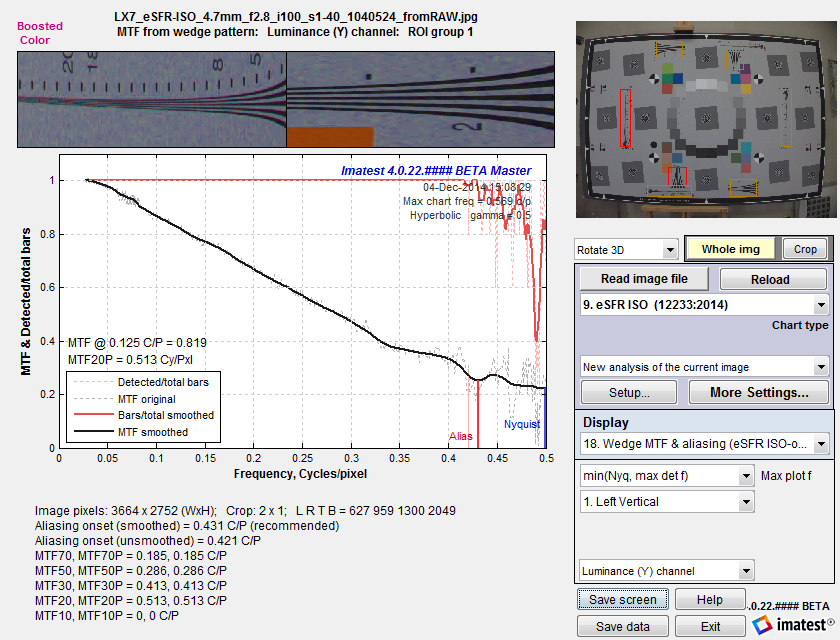
- Onset of aliasing and Moiré, measured from the four pairs of wedges in the Enhanced and Extended charts, whose spatial frequency range is the same as the separate ISO 12233:2017 wedge chart. Figures and results are identical to the Wedge module.
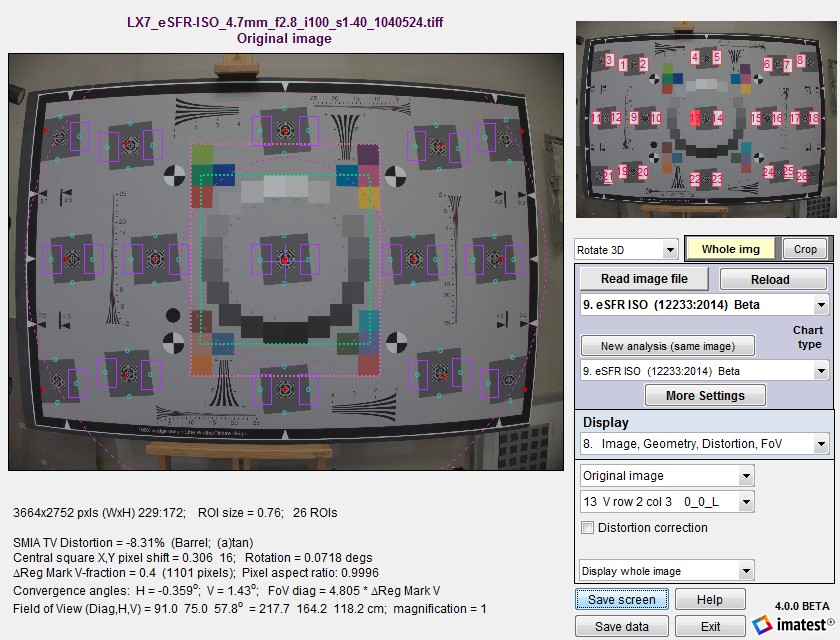
All chart features— slanted-edges, grayscale patches, color patches, and wedges— are located automatically. Special versions of eSFR ISO charts are available with extra wedges, pre-distortion (for use with extremely barrel-distorted "fisheye" lenses), or both.
 ▶
▶eSFR ISO operates in two modes.
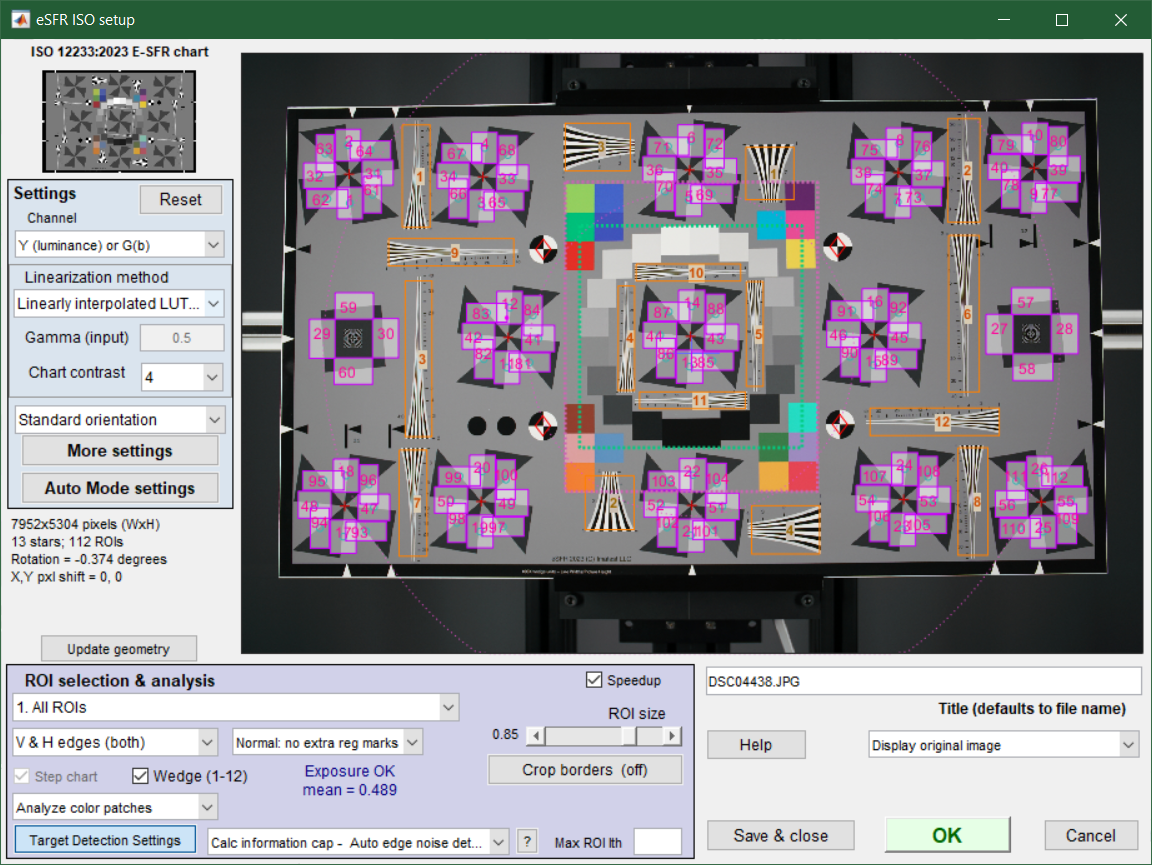
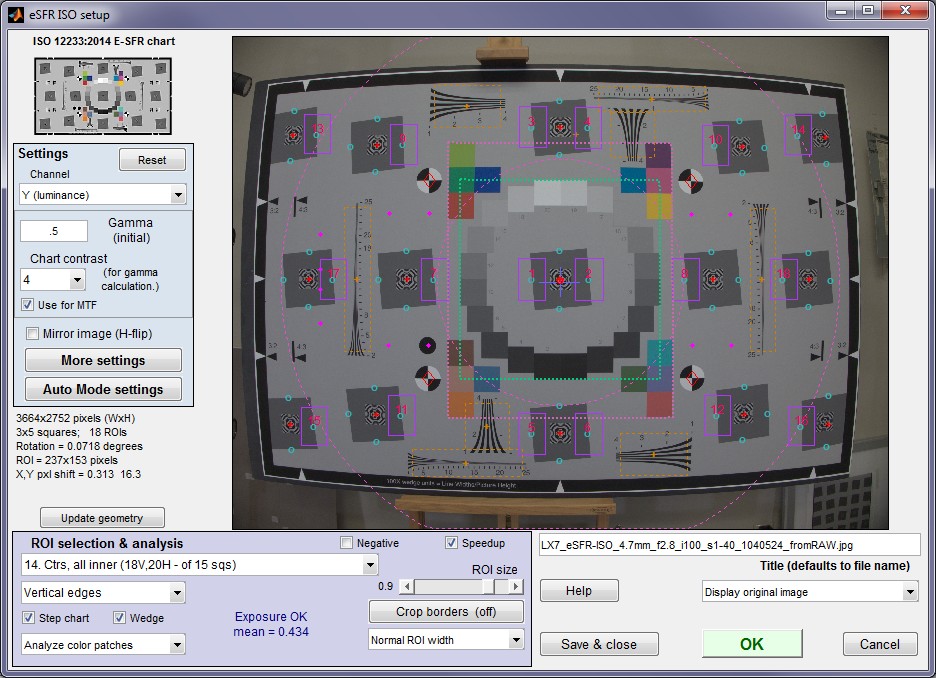
- Interactive/setup mode (run by pressing Rescharts or in the Imatest main window), which allows you to select settings and interactively examine results in detail. Saved settings are used for Auto Mode.
| All Rescharts (Interactive/Setup) modules can read images from image files (raw and interchangeable) ♦ via direct data acquisition from a variety of devices |
- Auto mode (run by pressing in the Imatest main window), which runs automatically with no additional user input. ROIs are located automatically based on settings saved from the interactive/setup mode. This allows images of different sizes and framing to be analyzed with no change of settings. Auto mode works with large batches of files, and is especially useful for automated testing, where framing may vary from image to image.
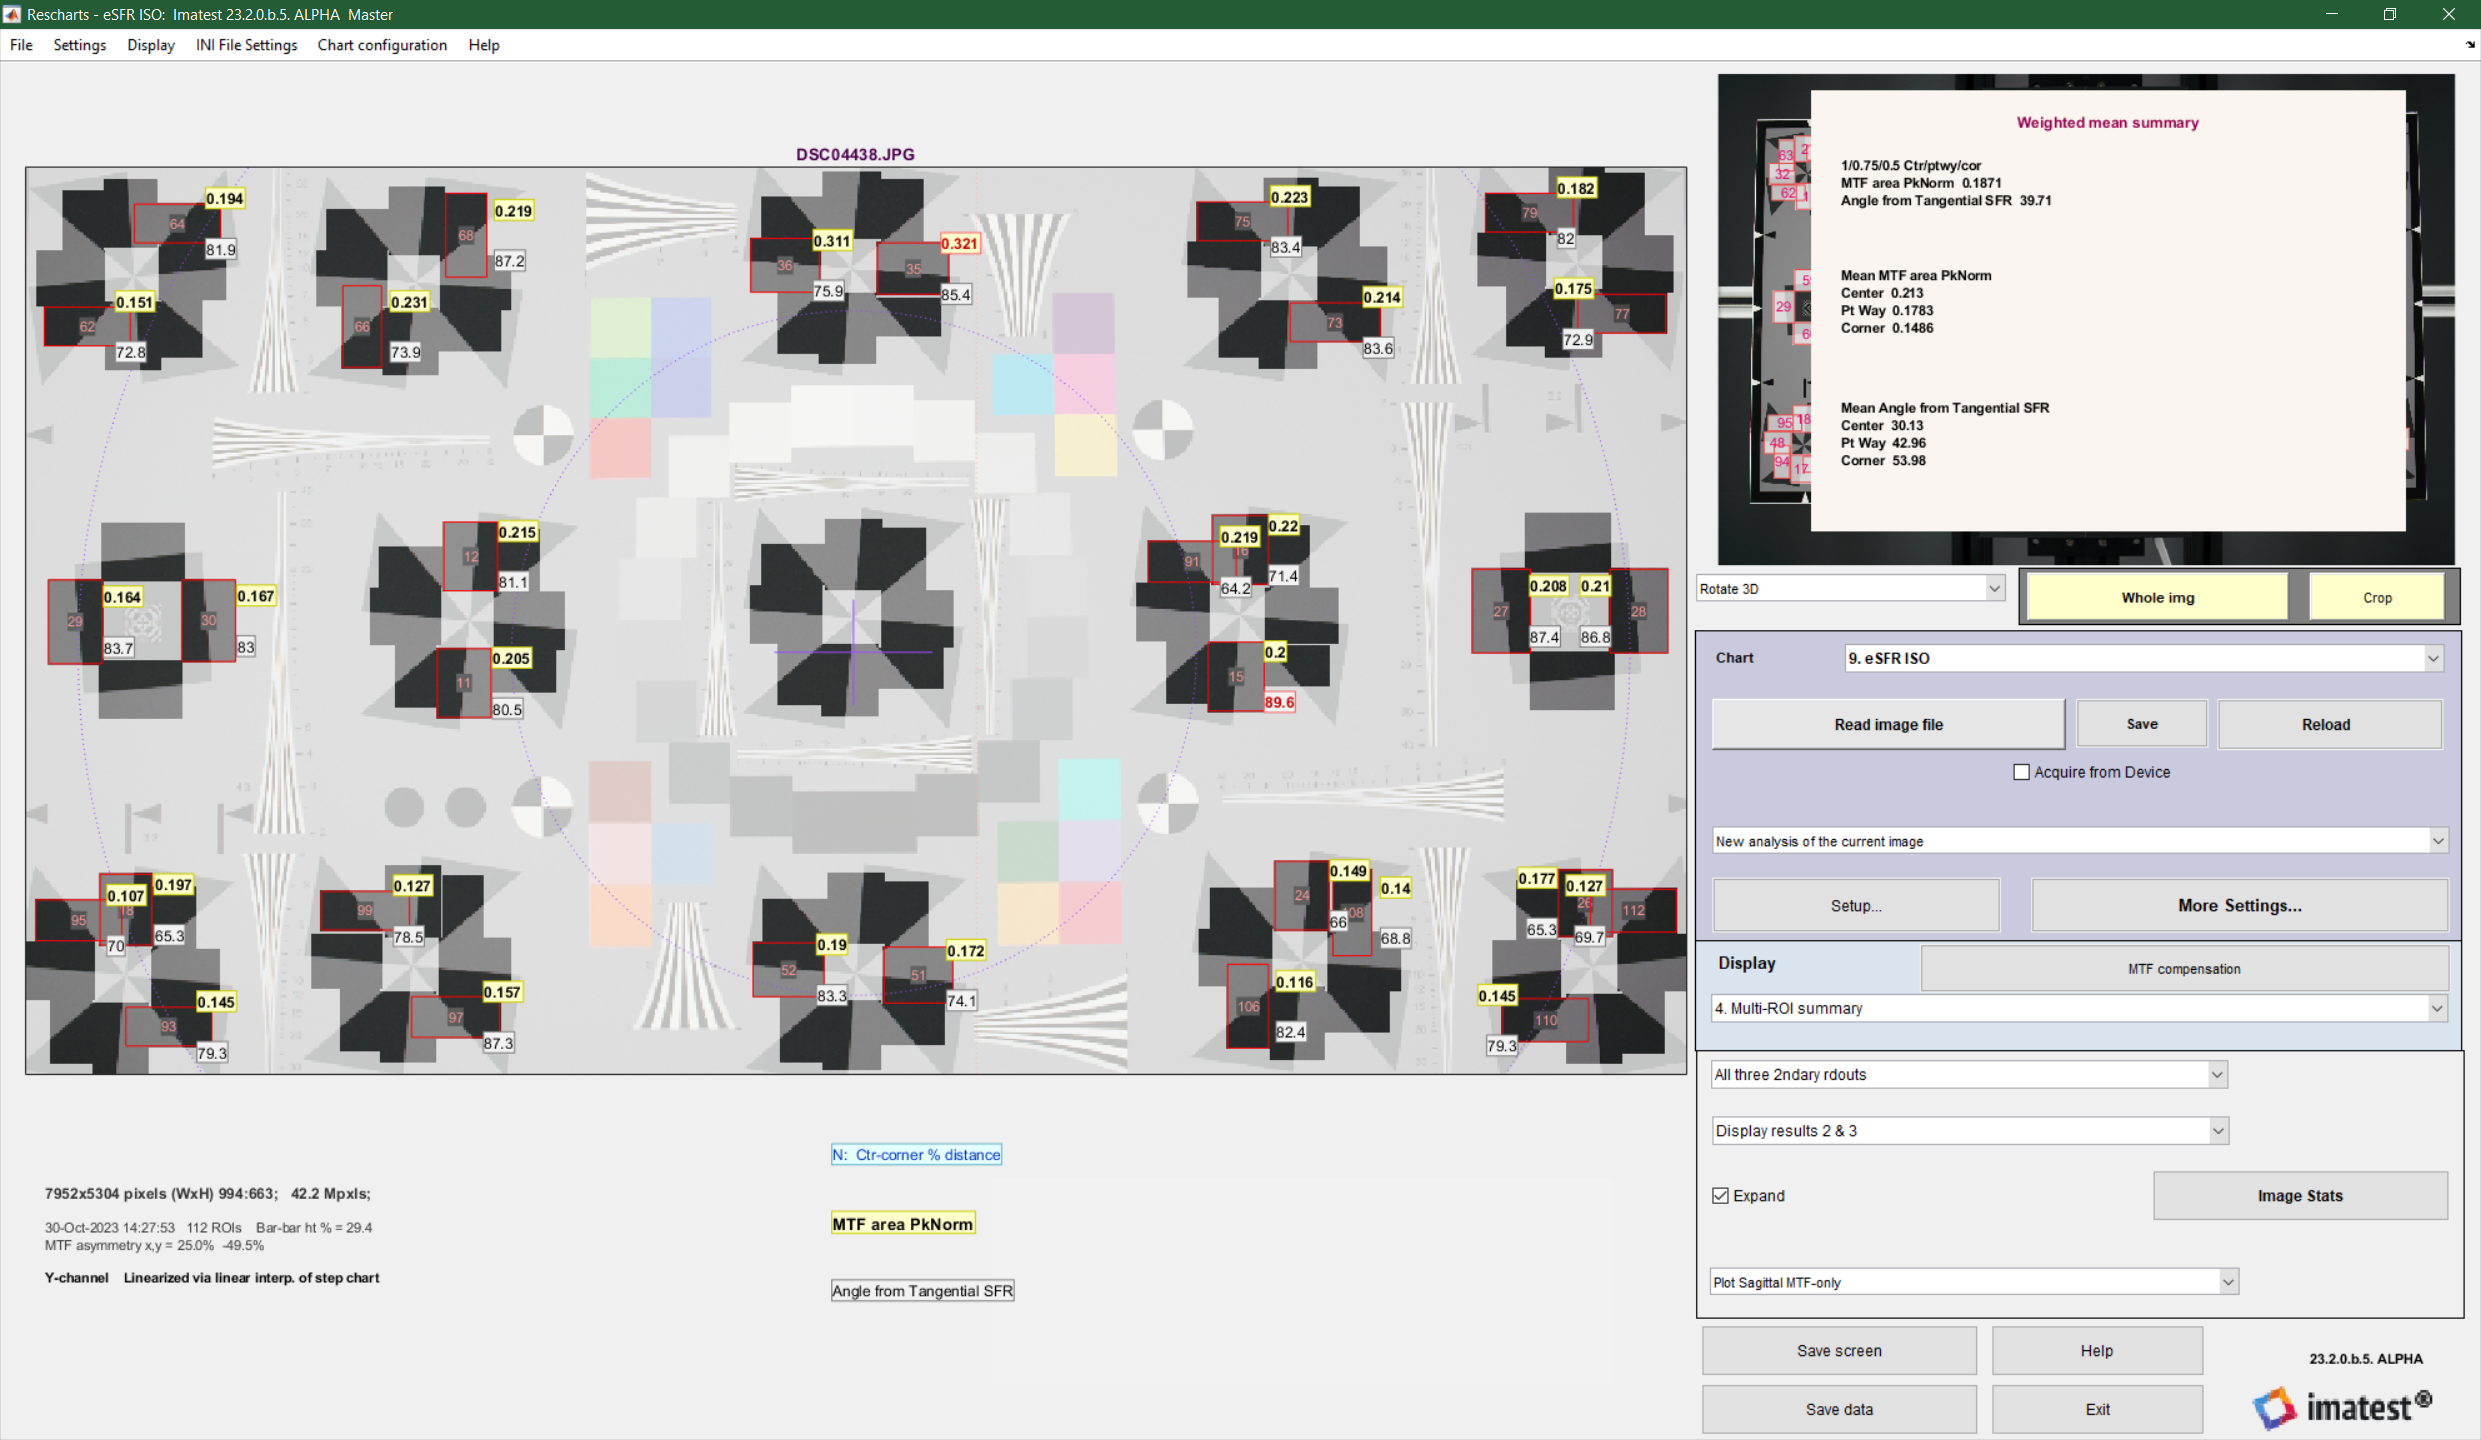
This document introduces eSFR ISO and explains how to obtain and photograph the chart. Part 2 shows how to run eSFR ISO interactively inside Rescharts and how to save settings for automated runs. Part 3 and Part 4 illustrates the results for slanted-edge and other measurements, respectively.
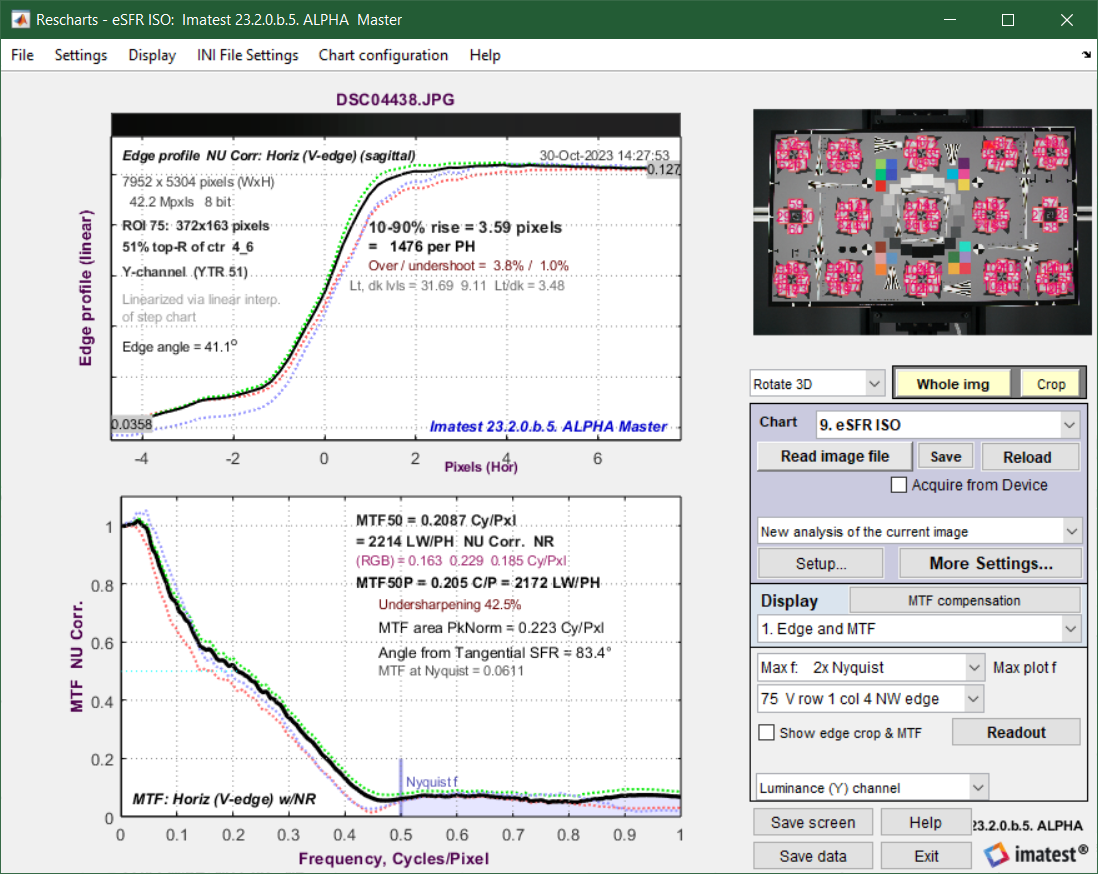
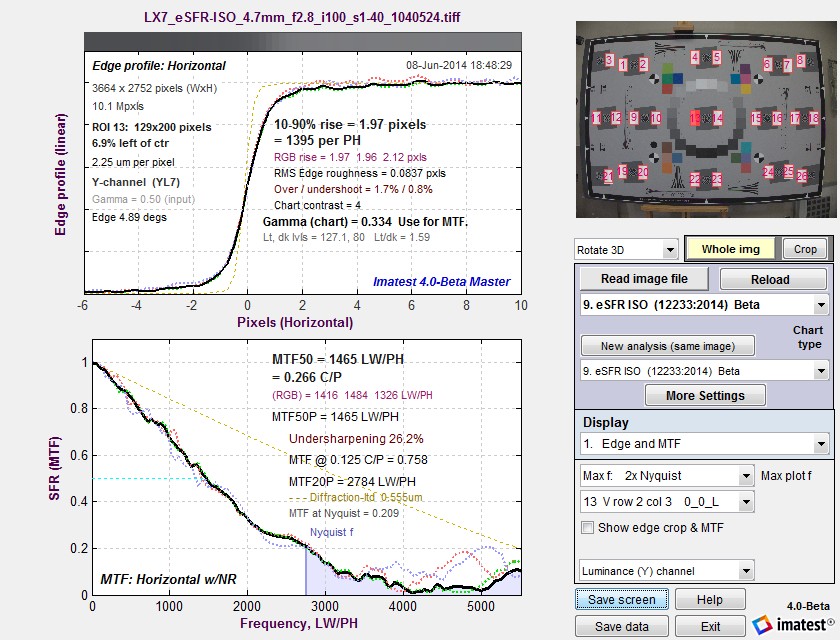
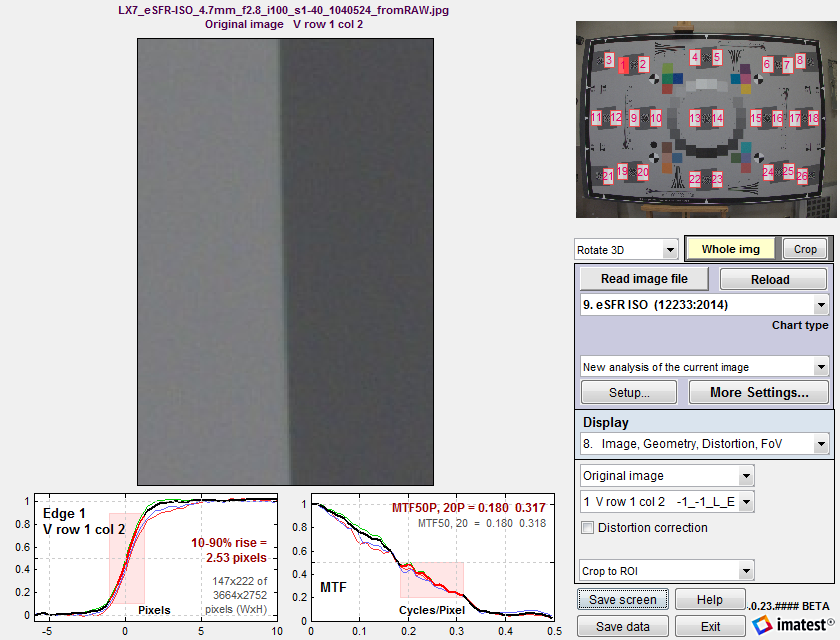
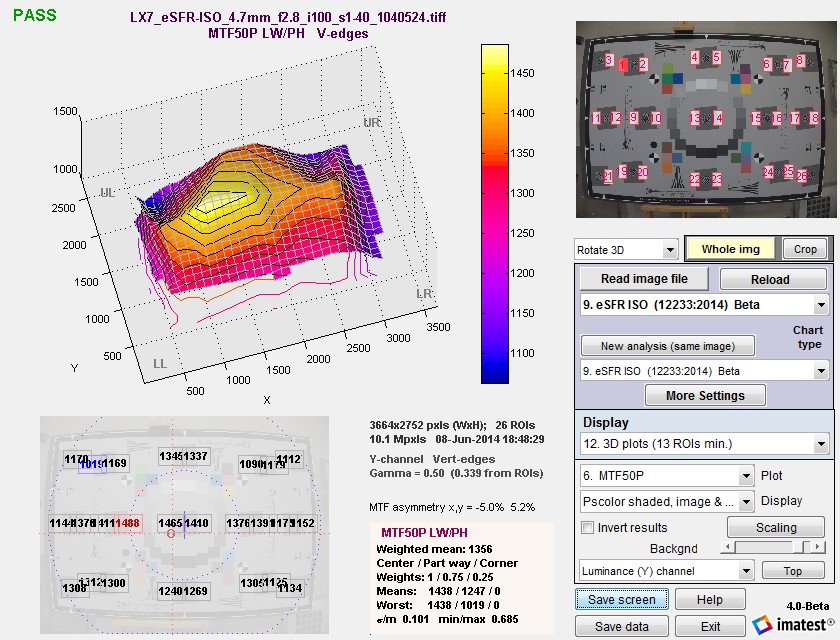
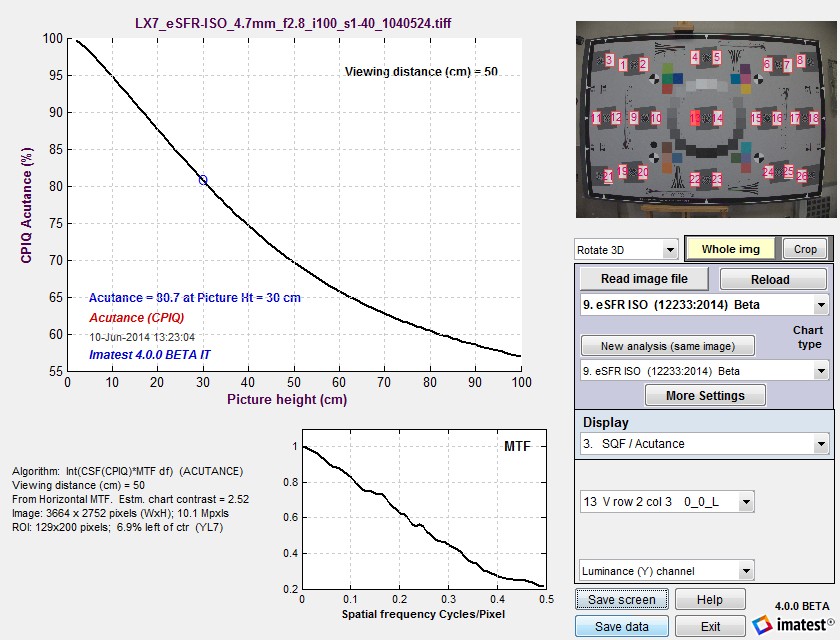
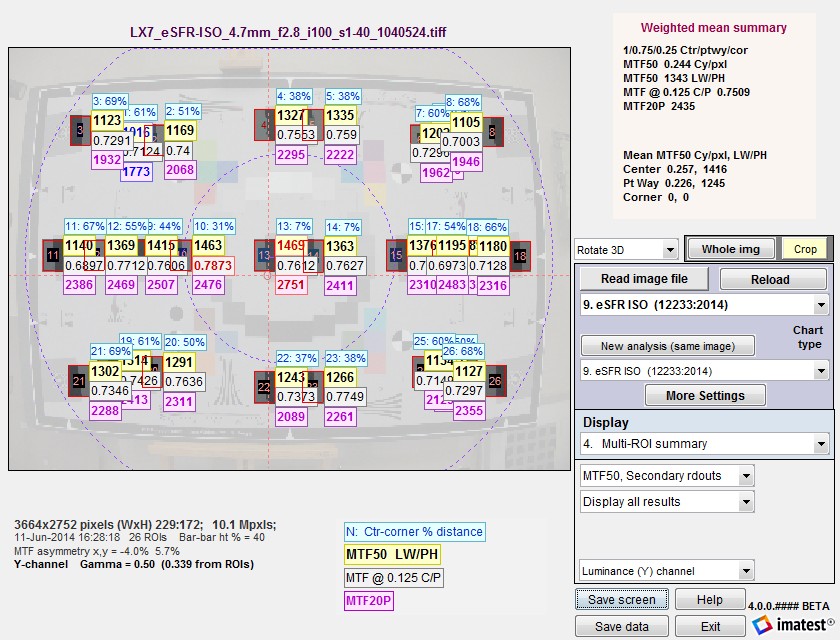
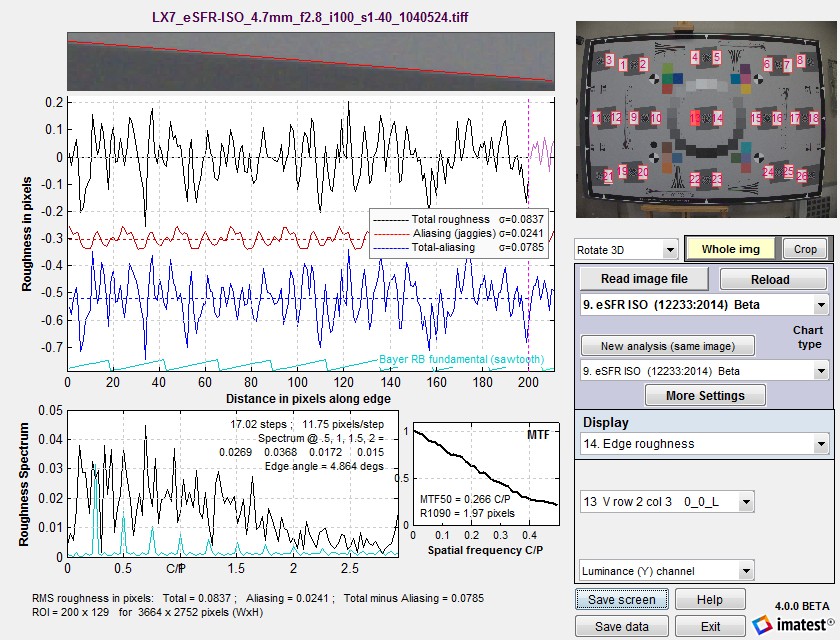
The images below show the many capabilities of eSFR ISO.
Each image is described below it. Results are described in more detail in Part 3.
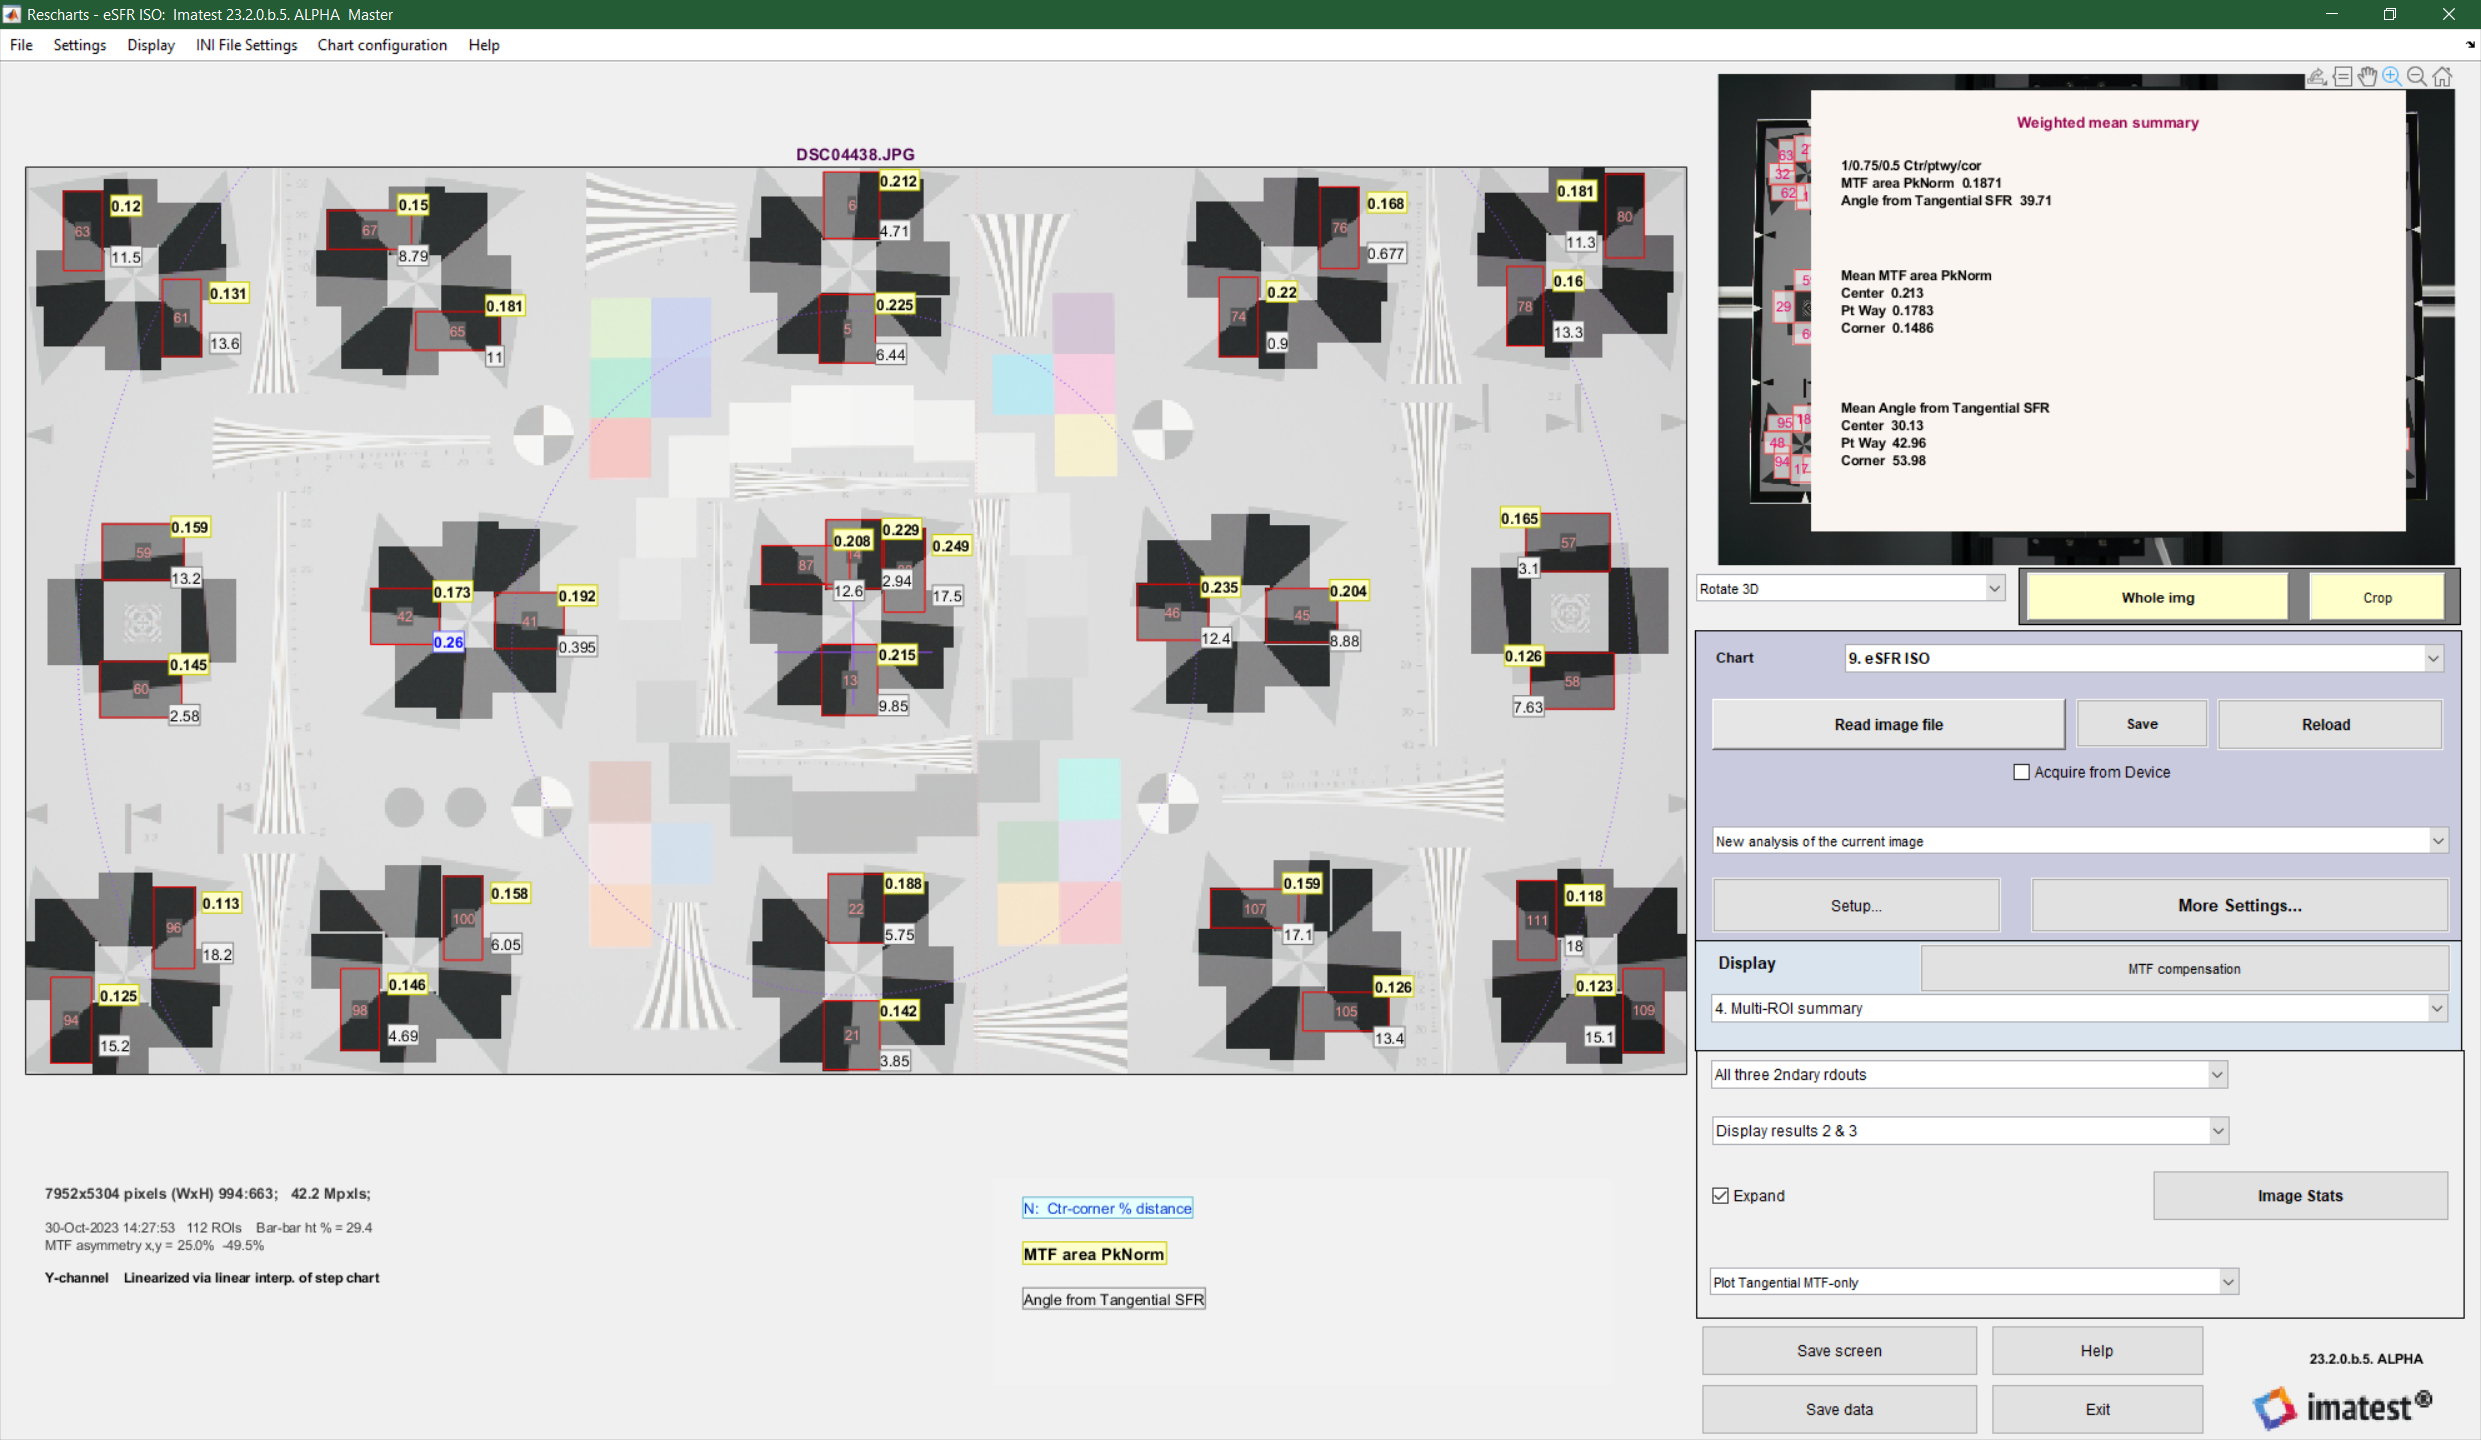
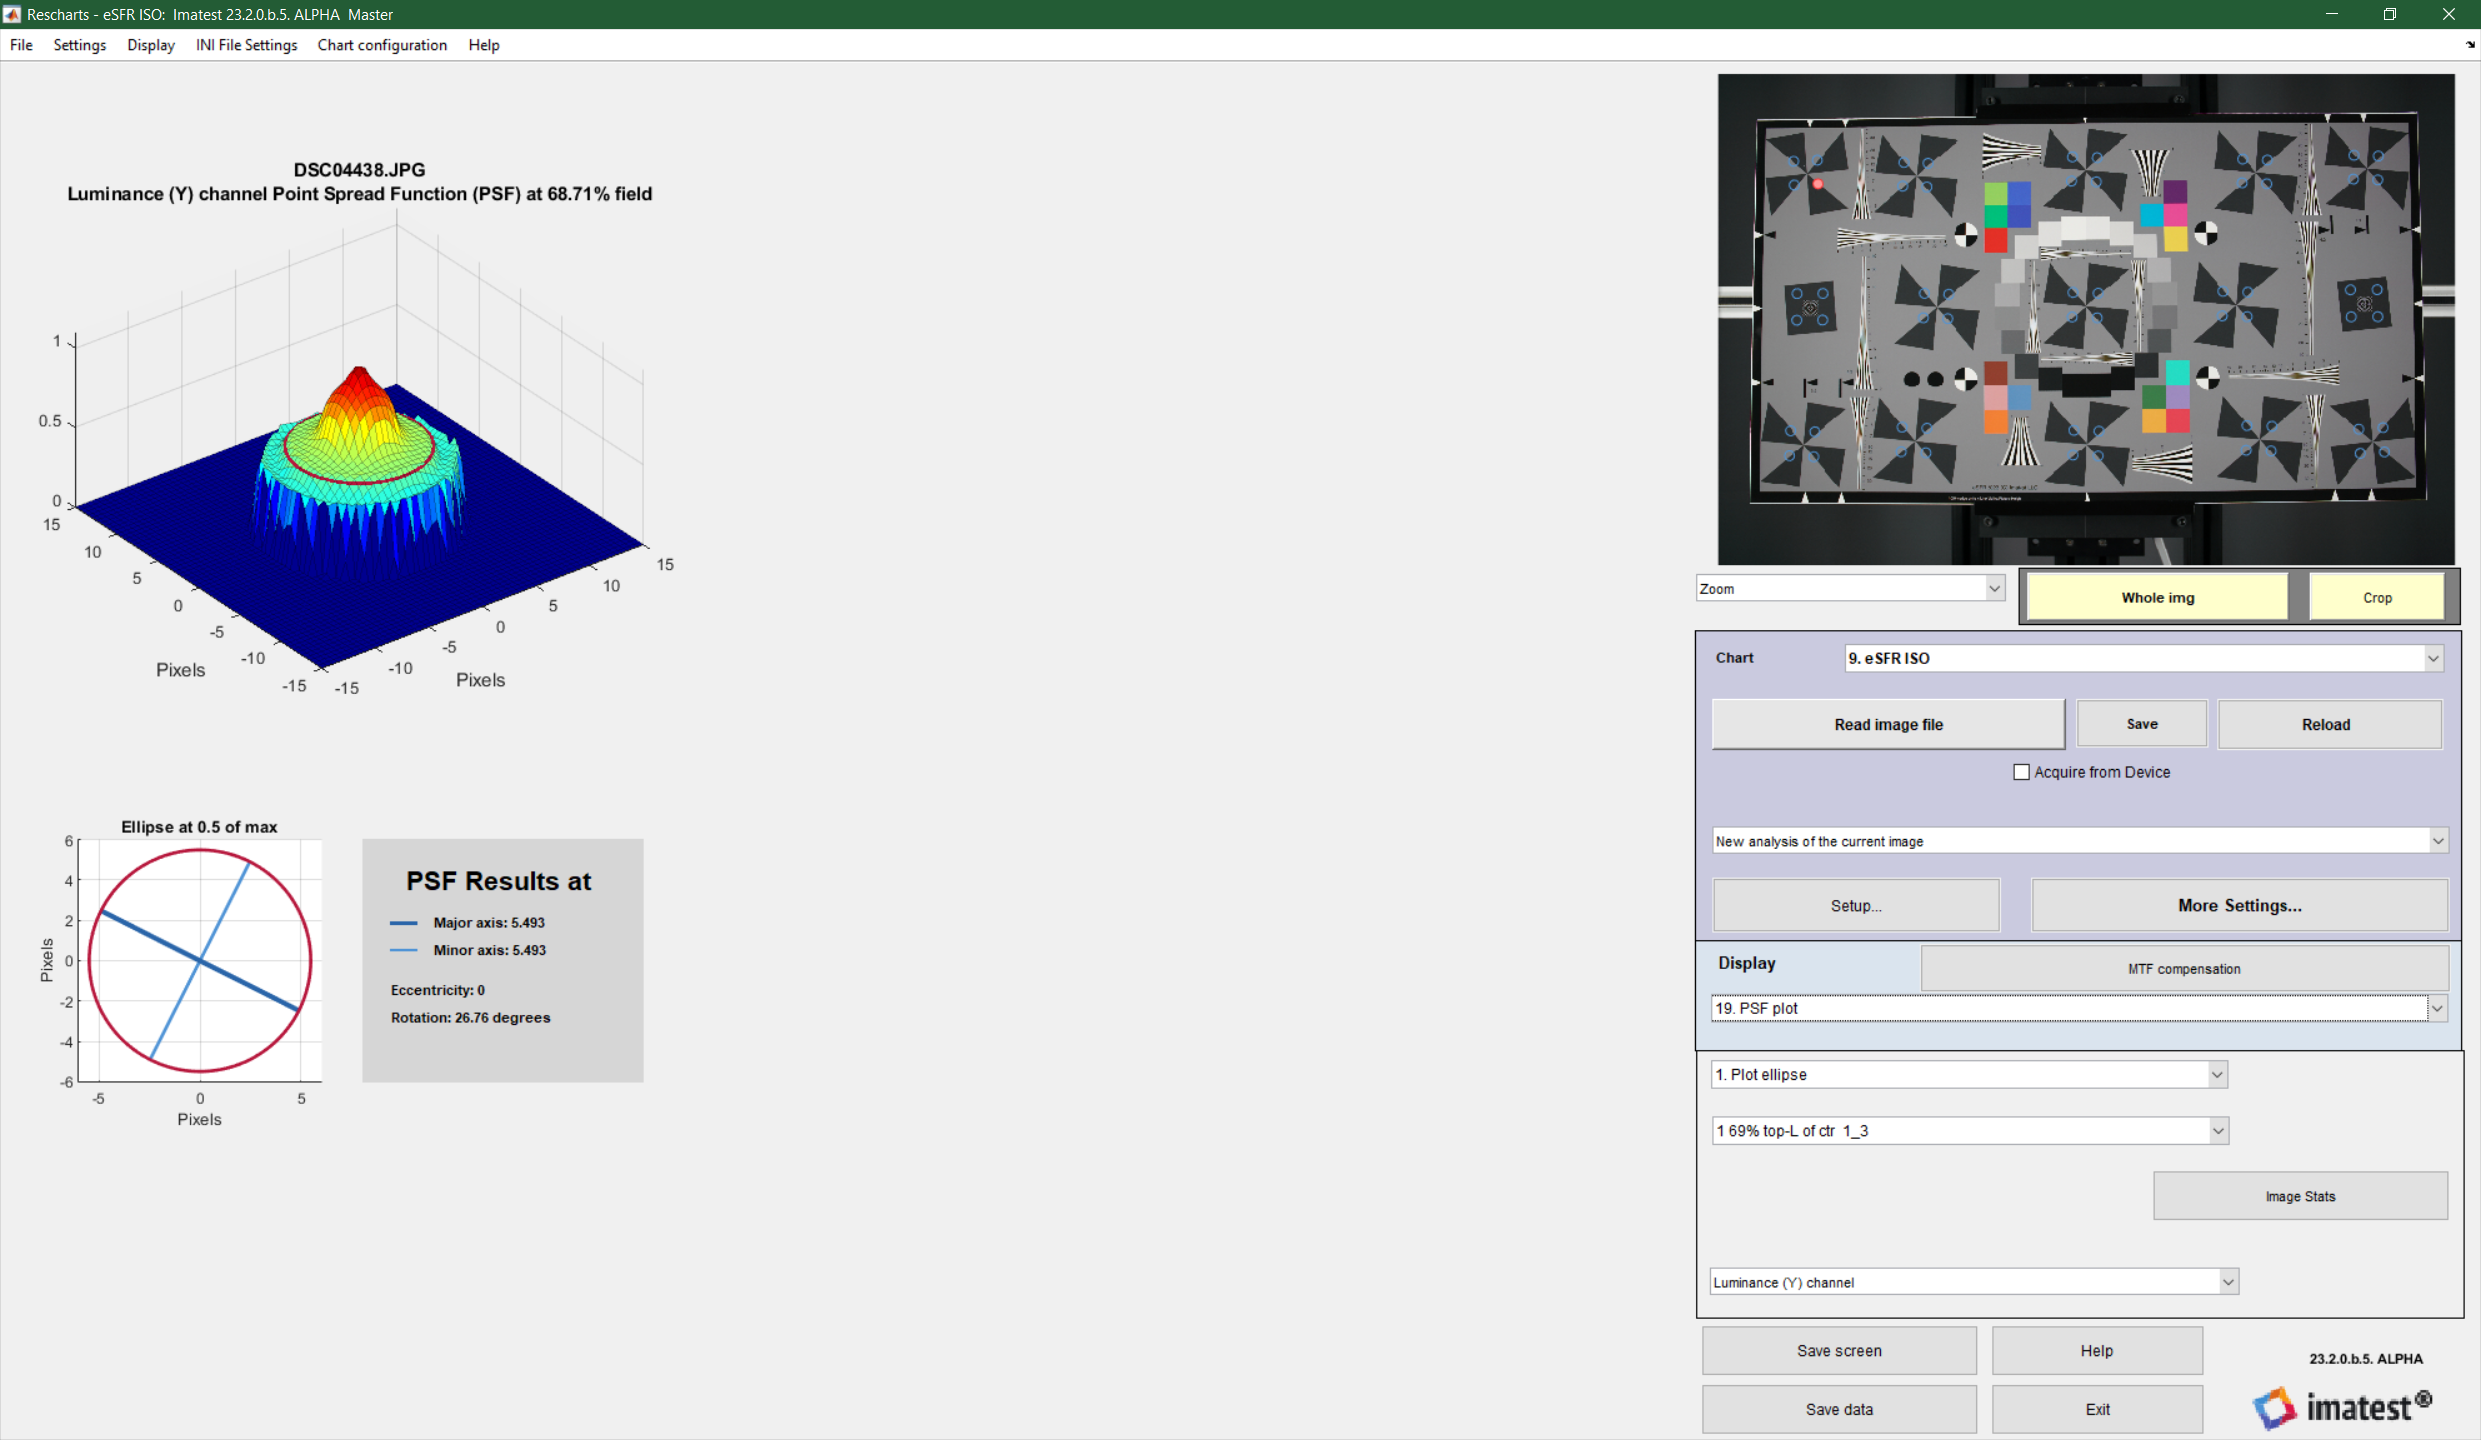
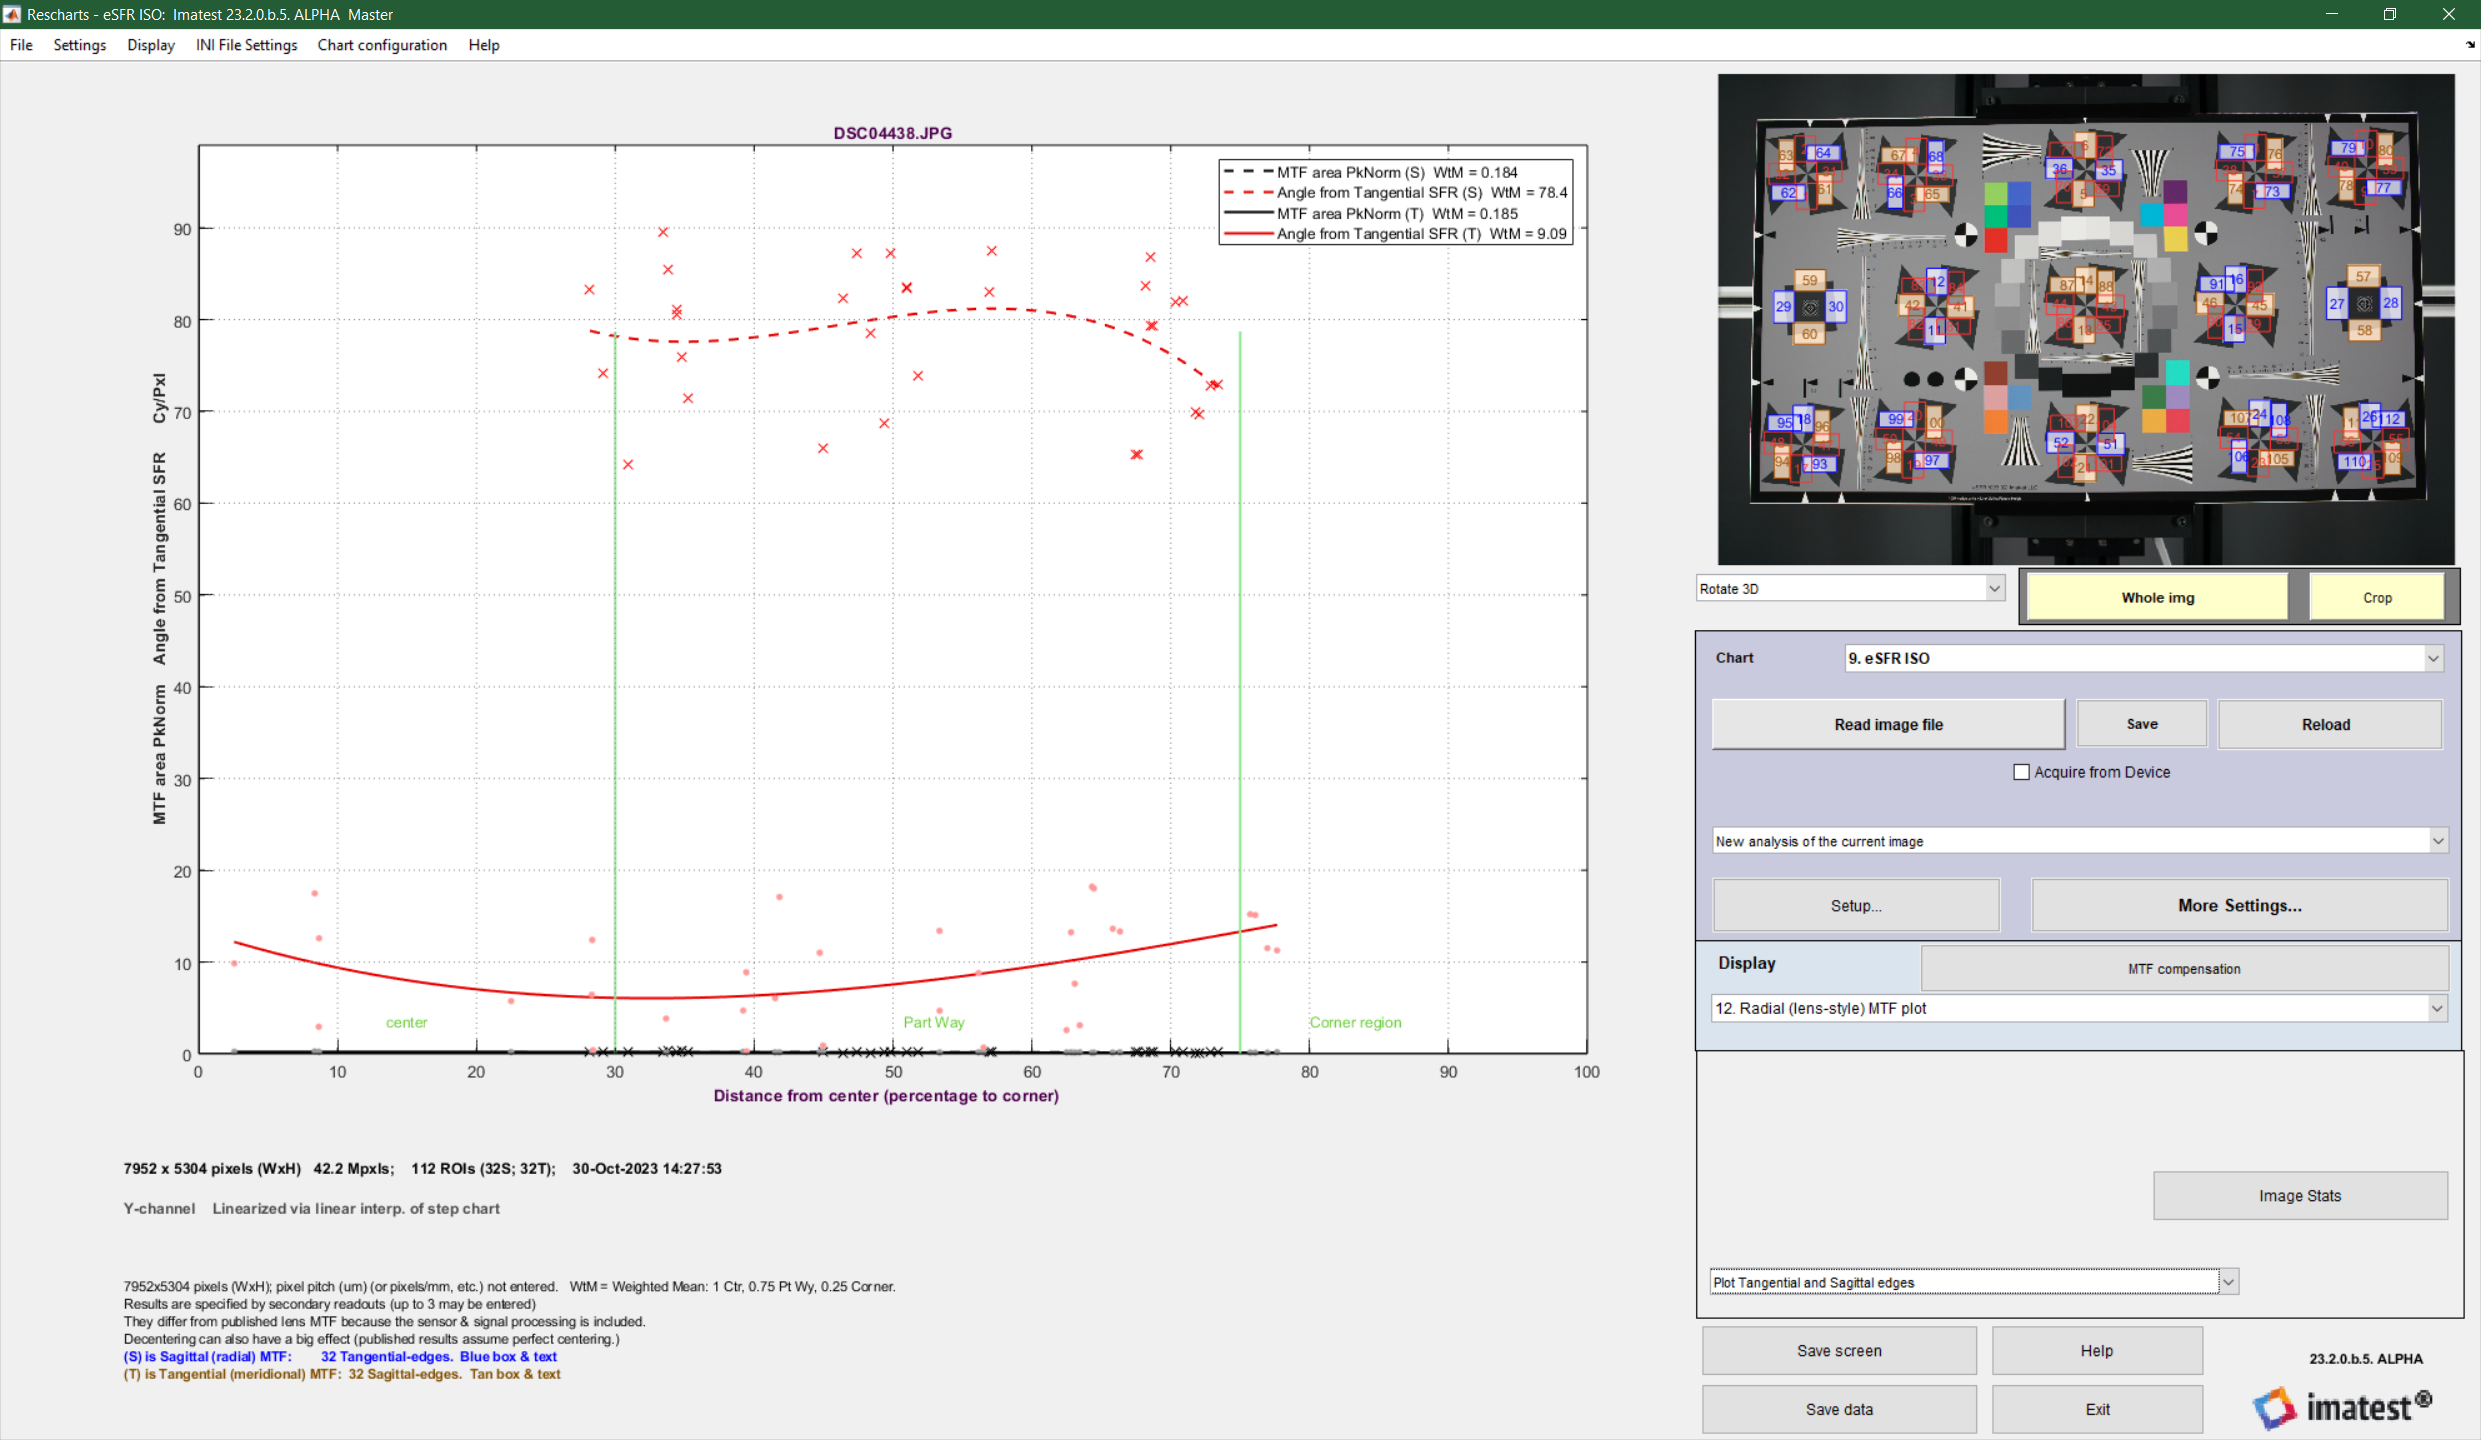
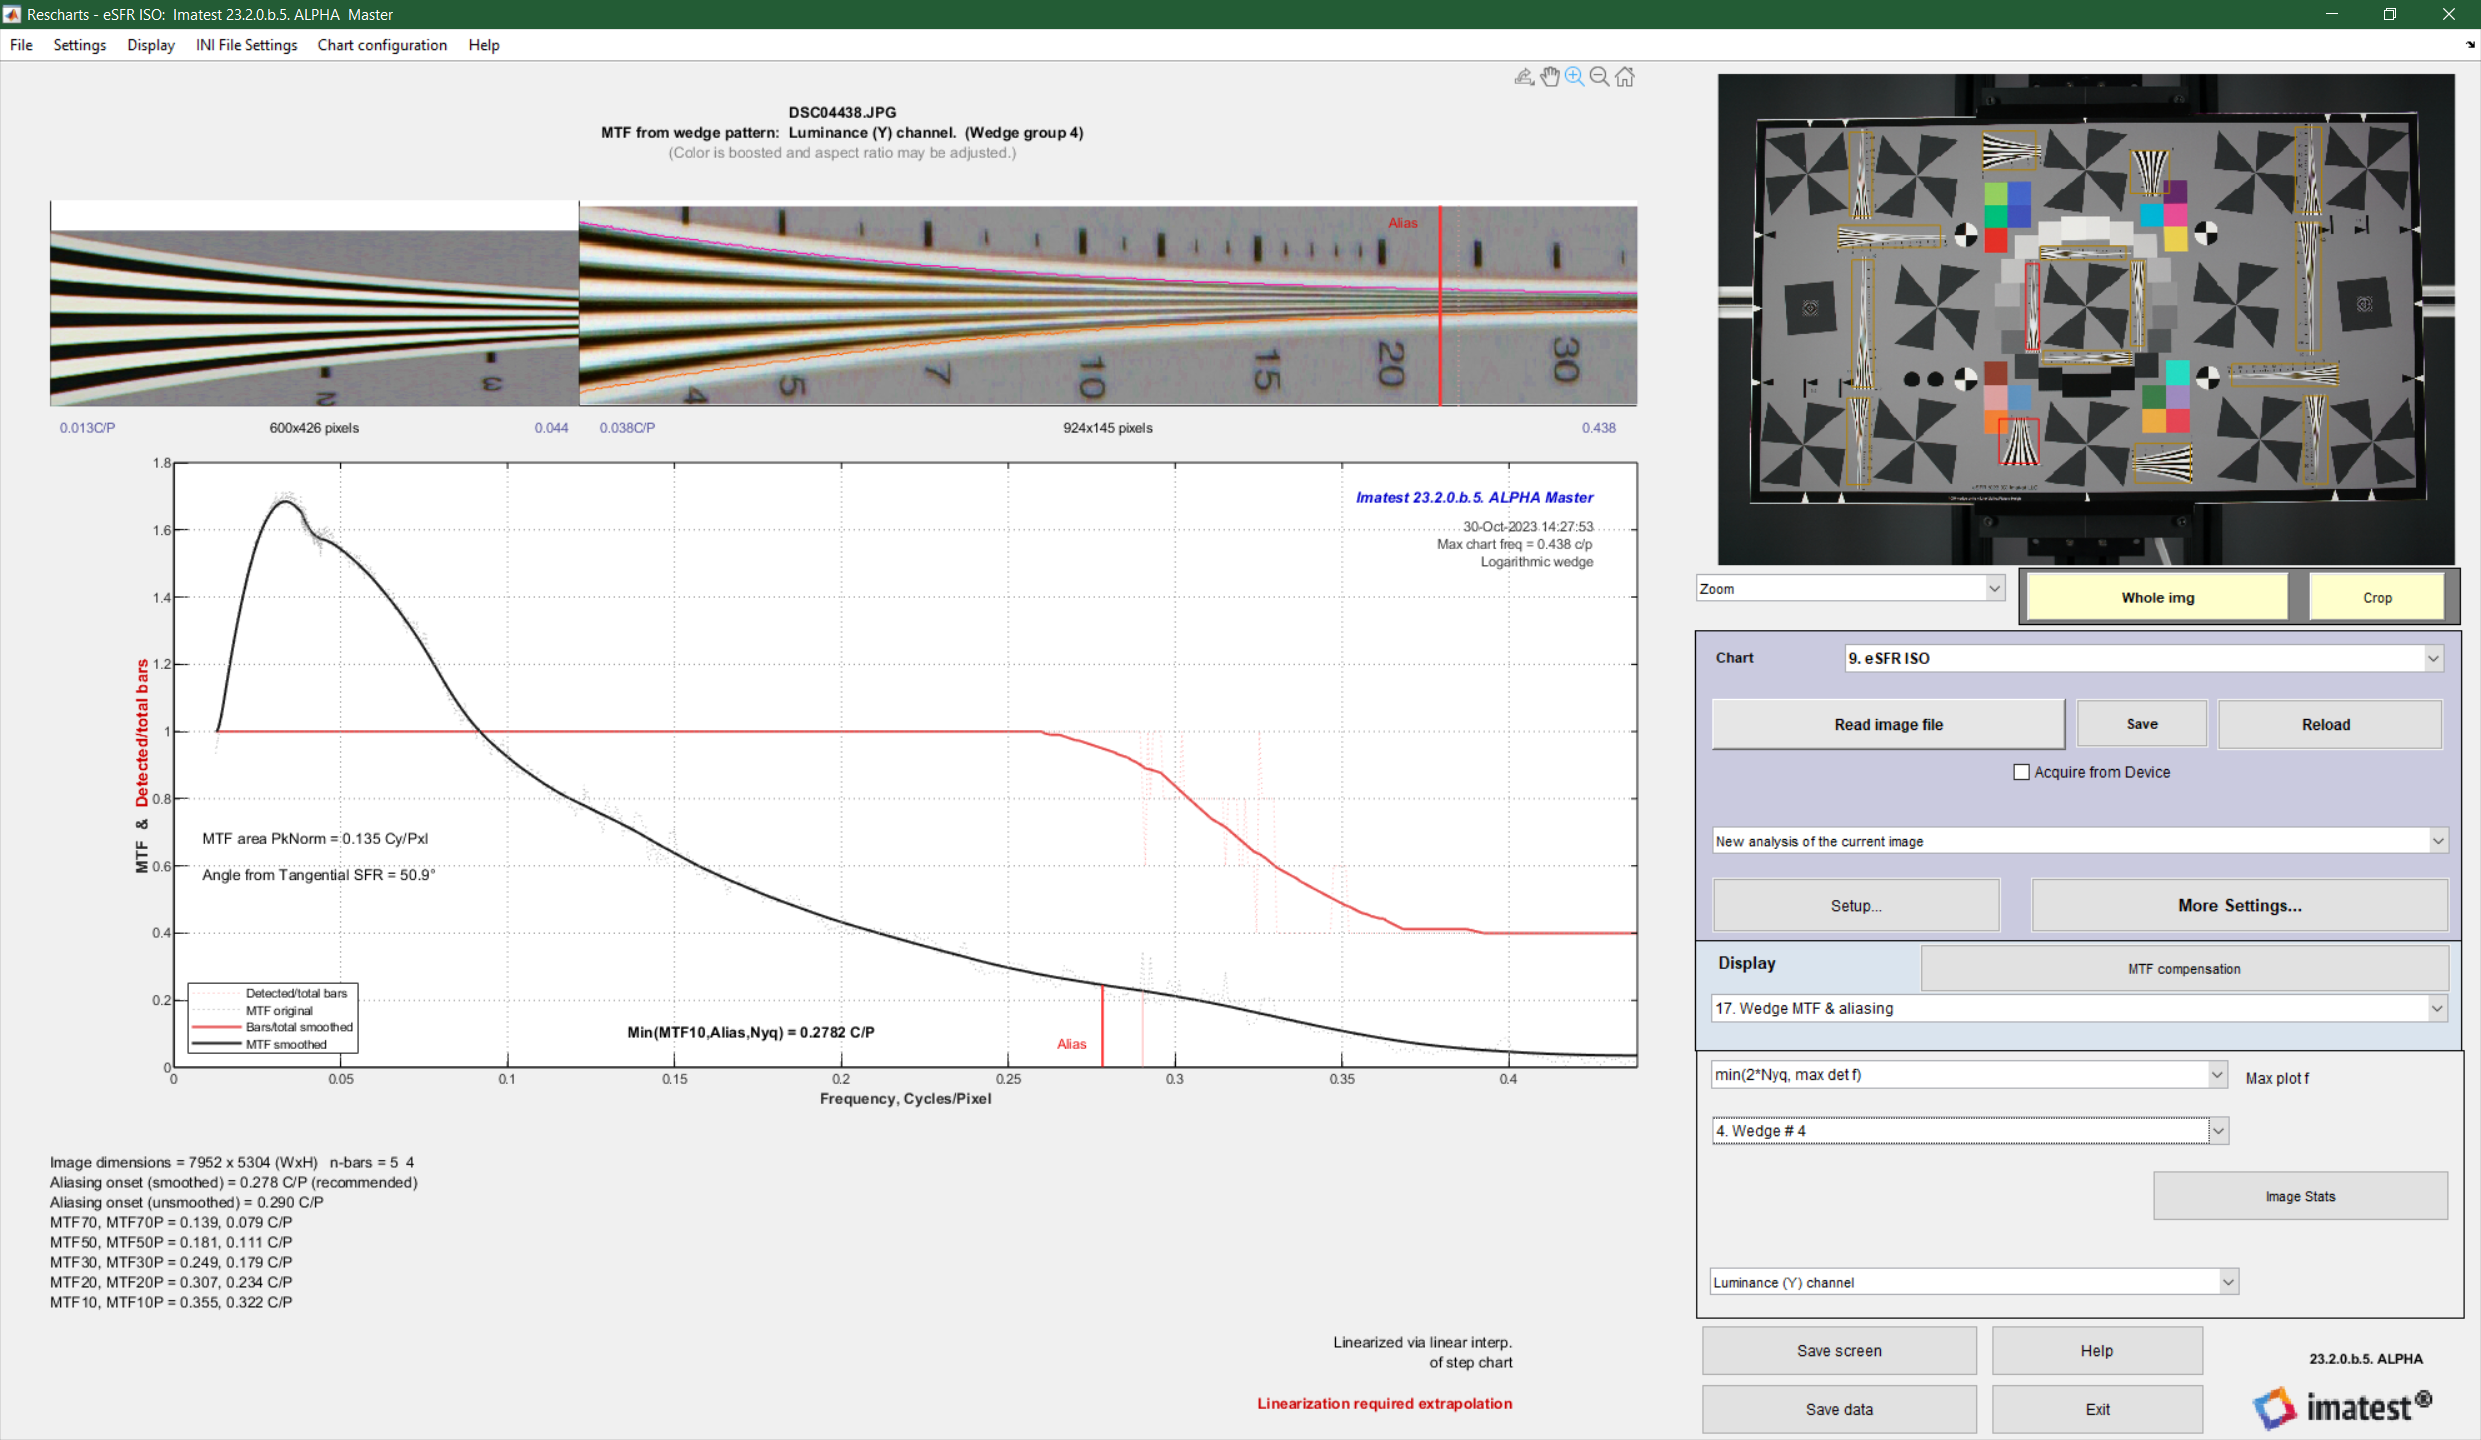
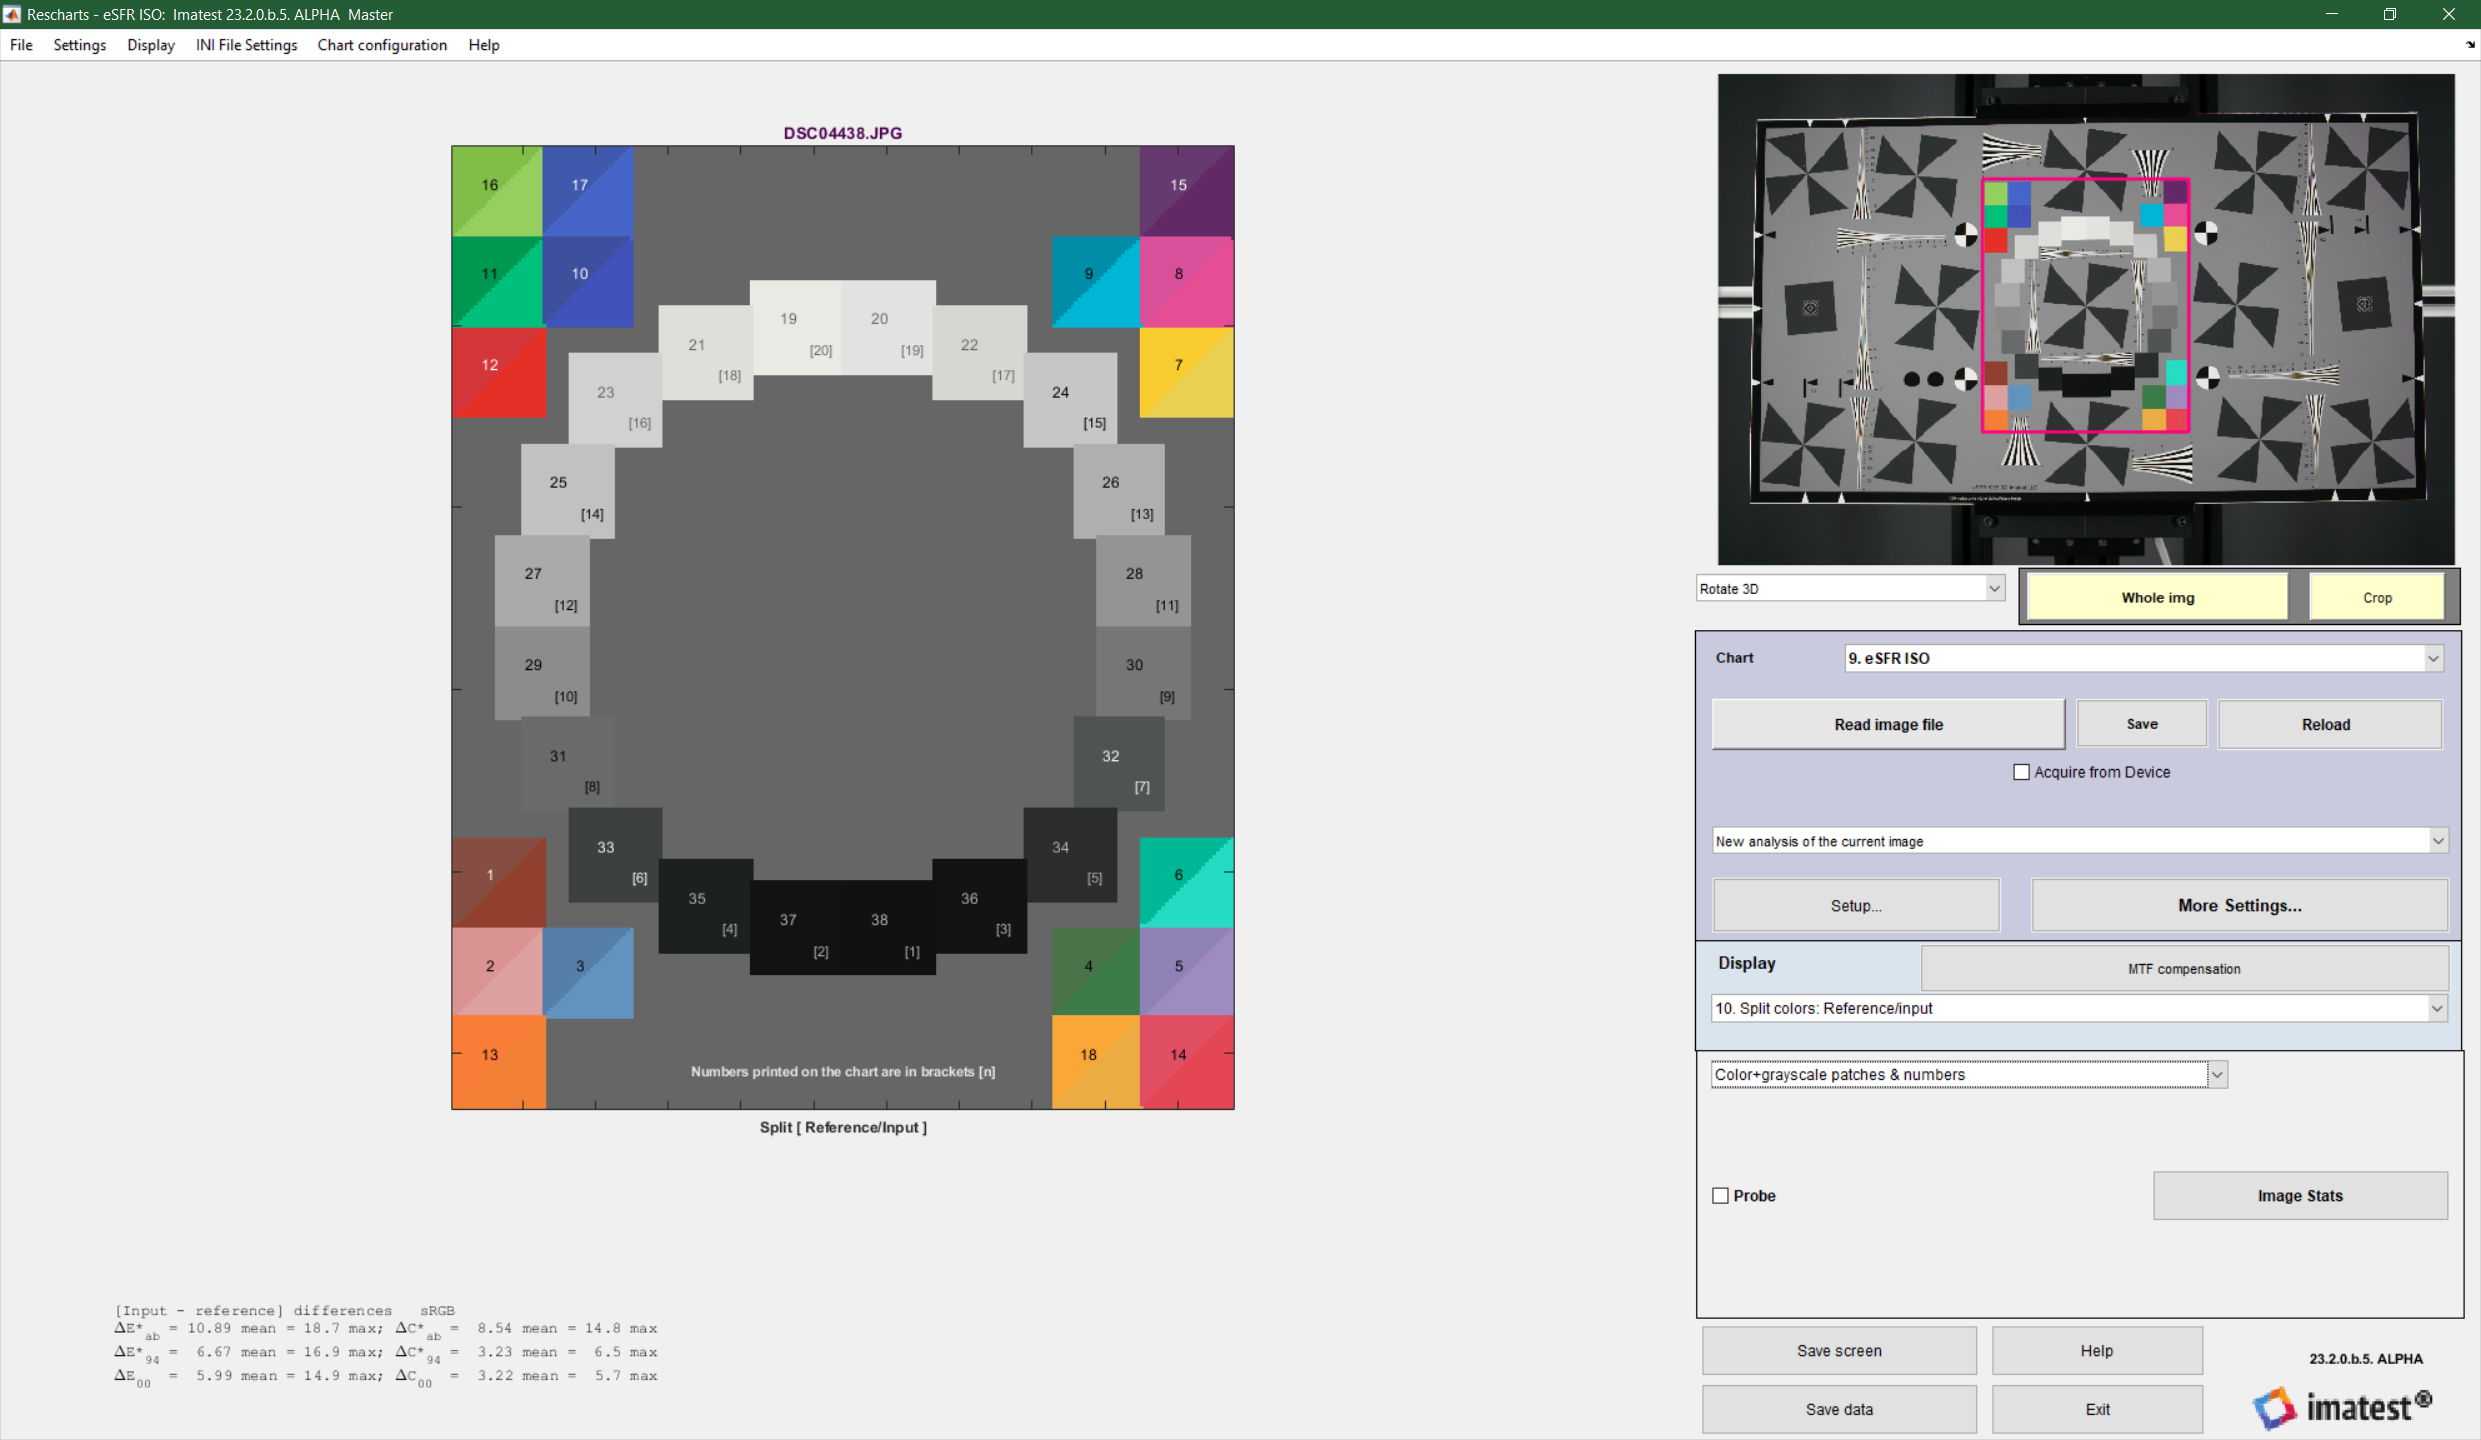
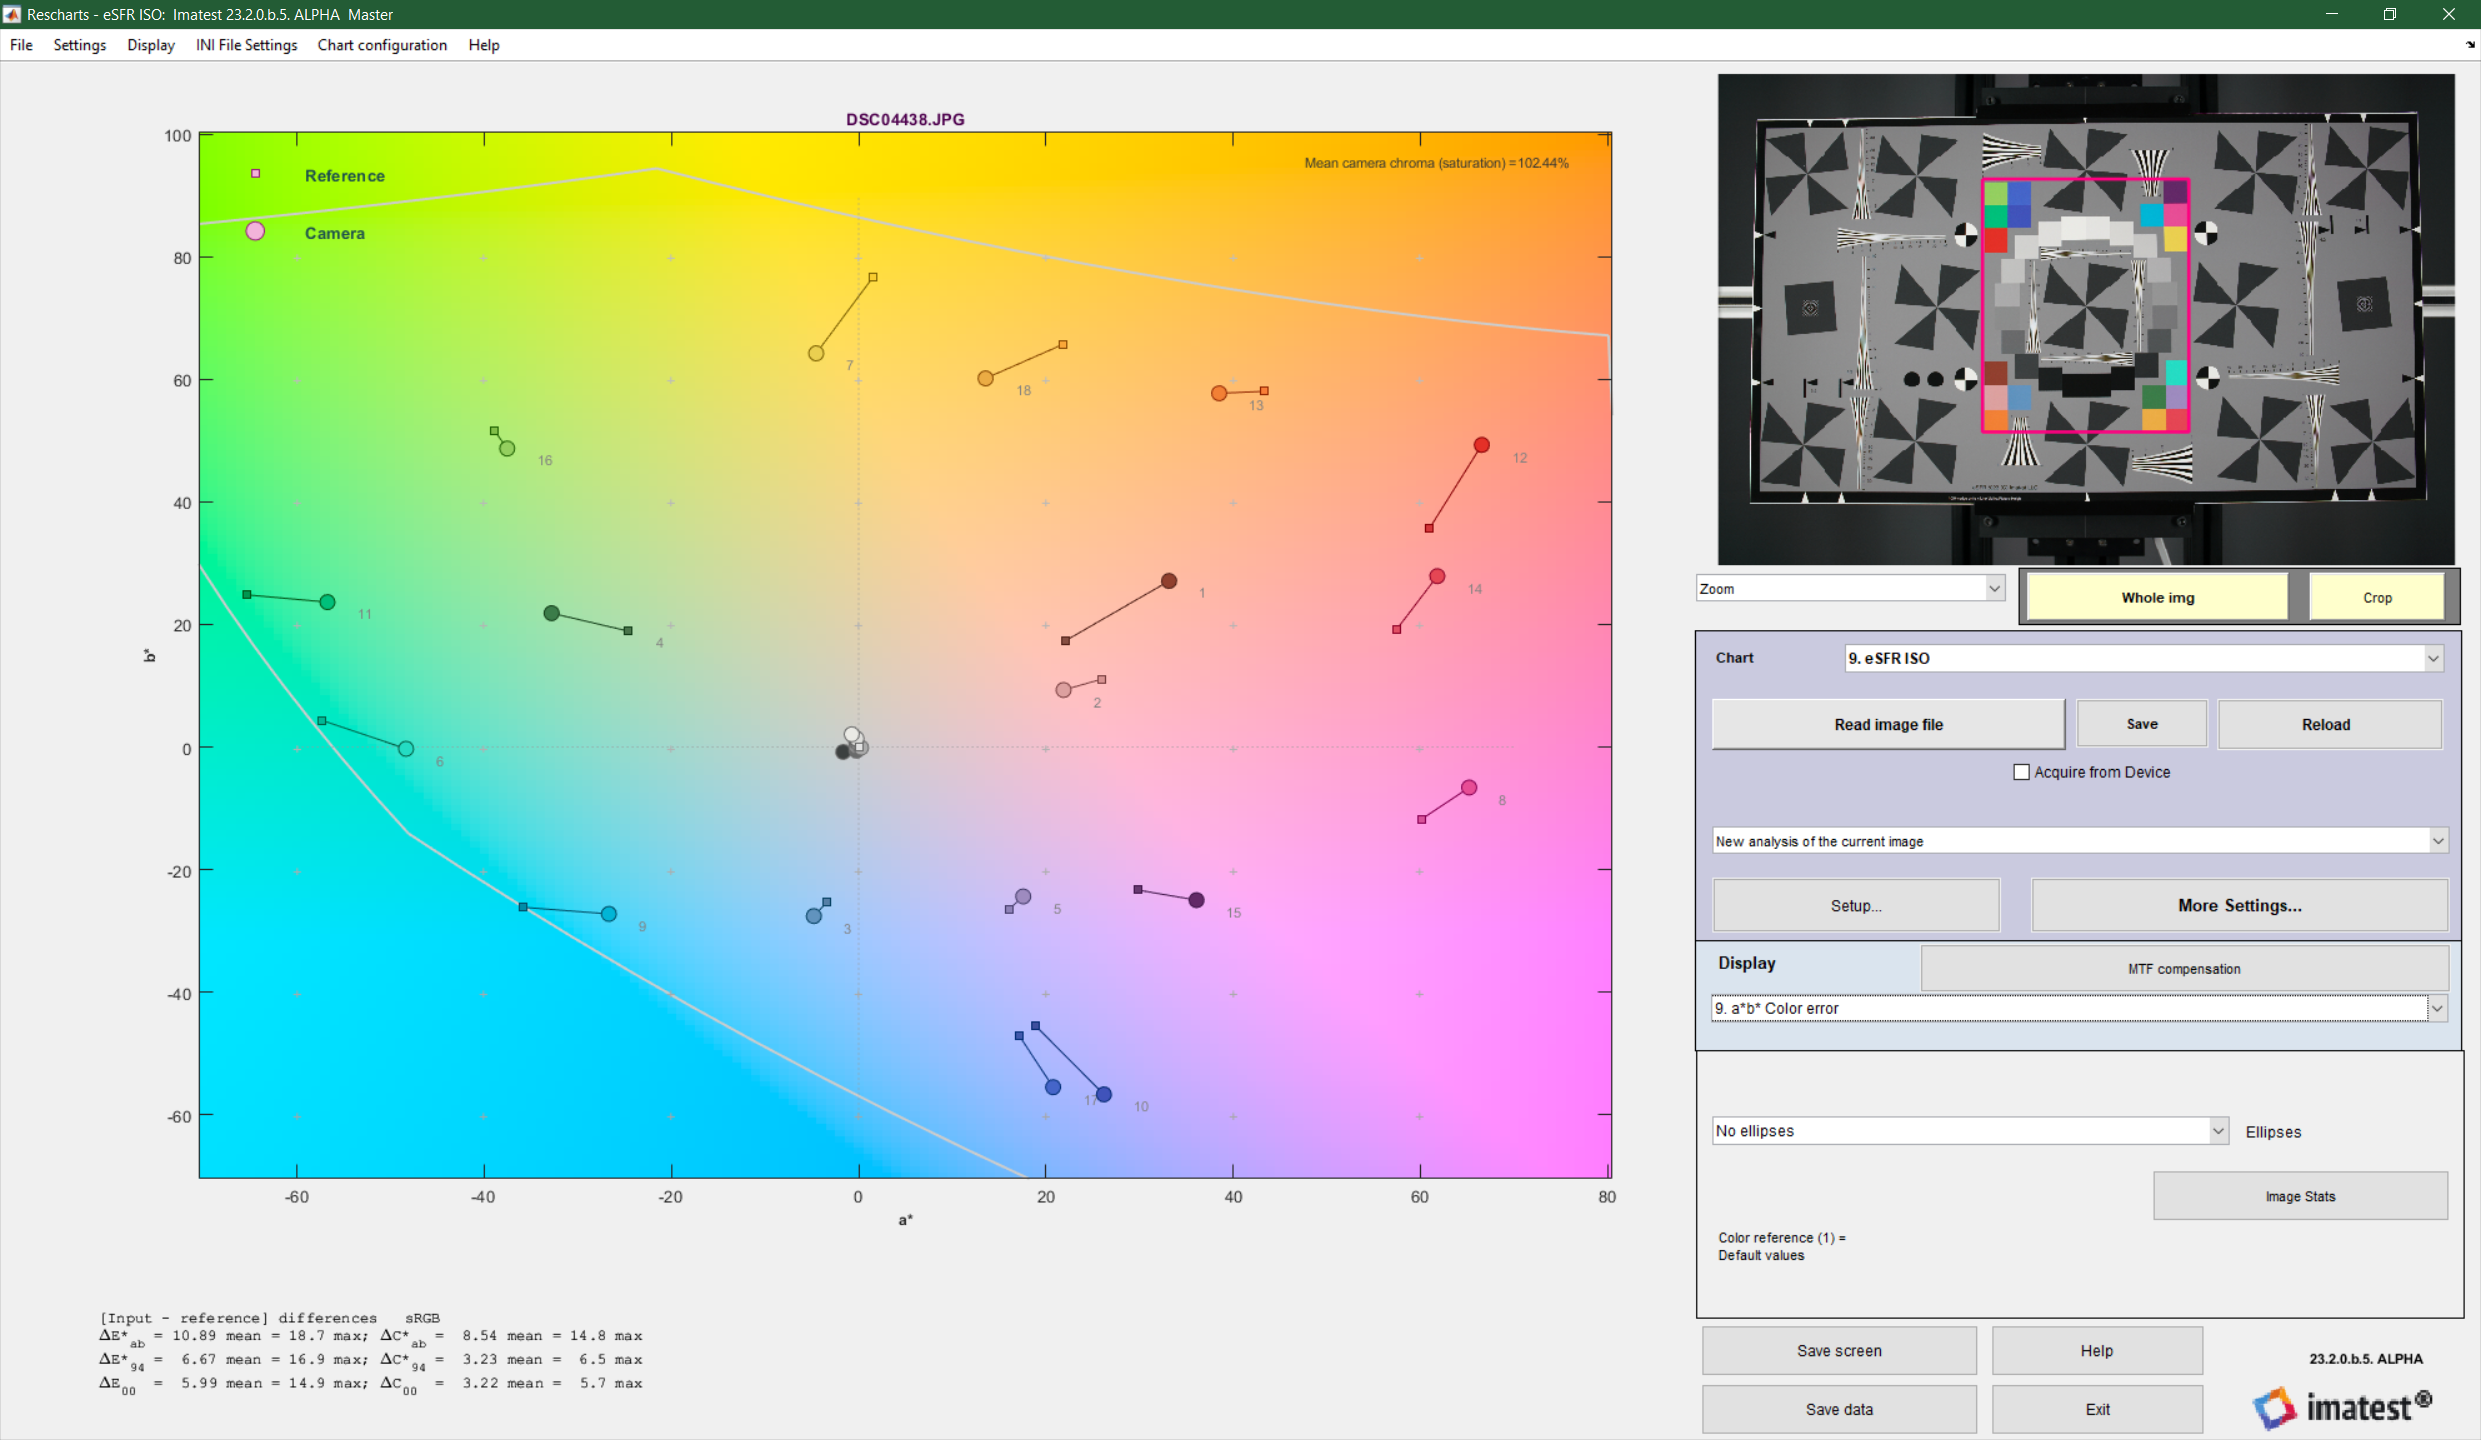
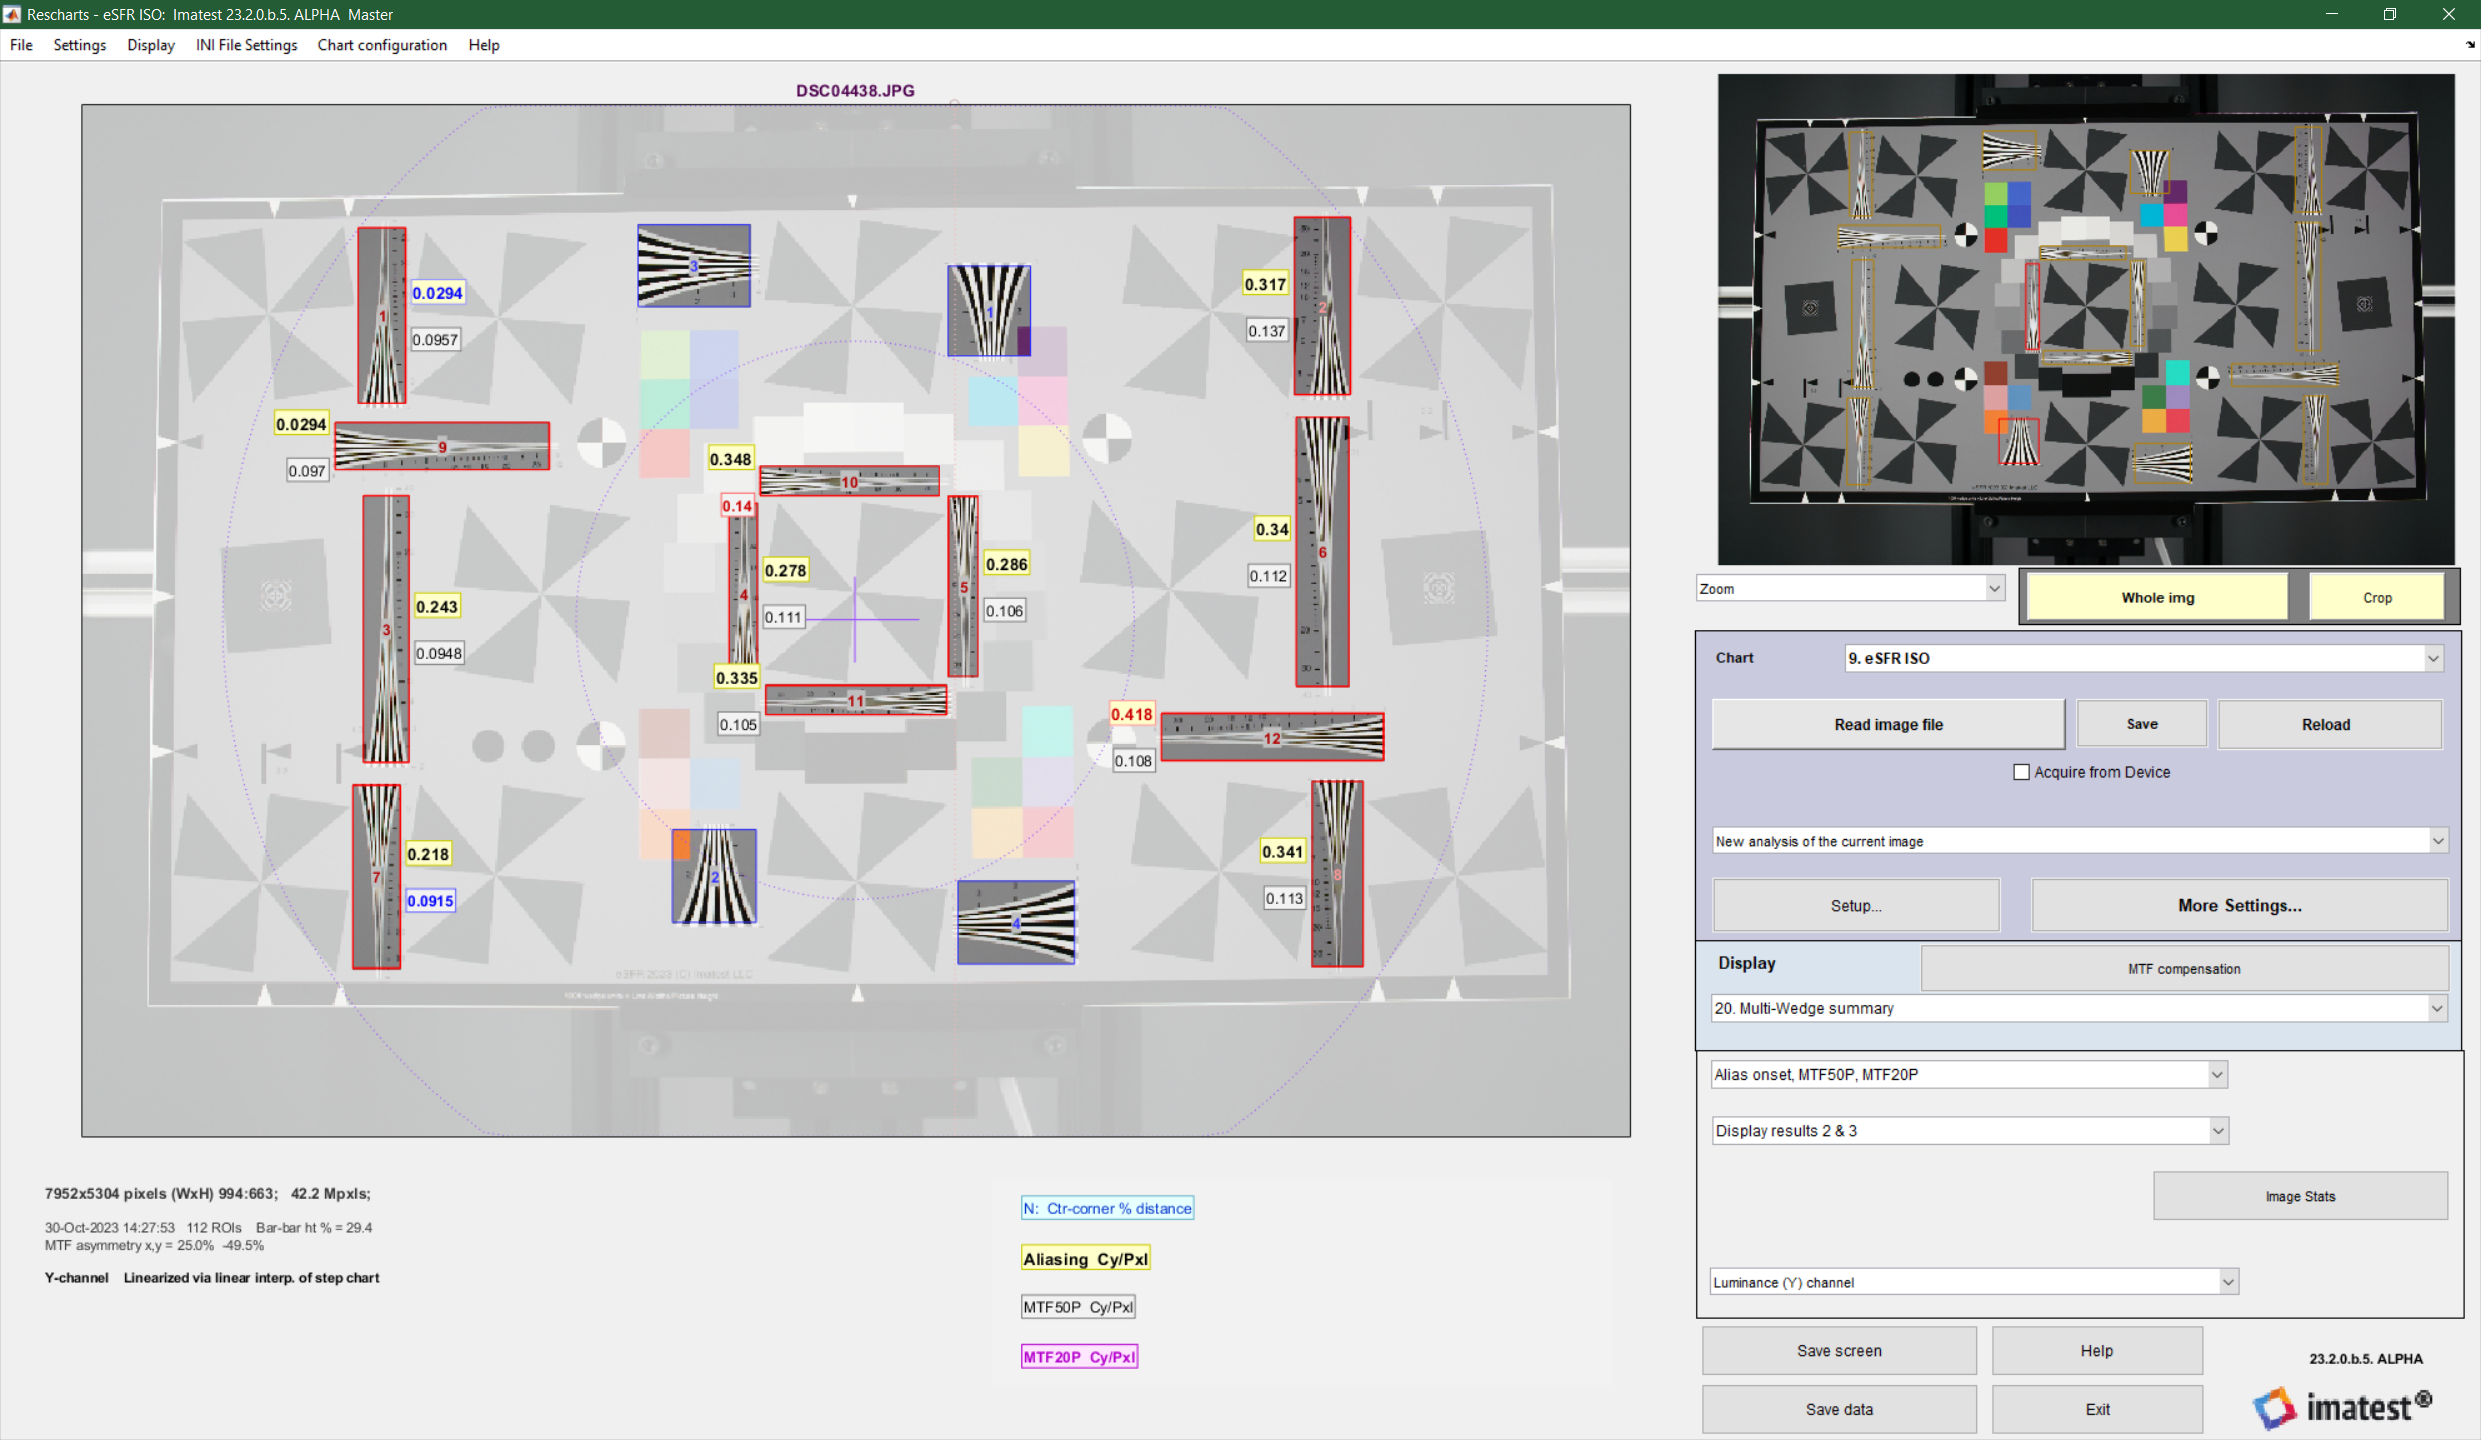
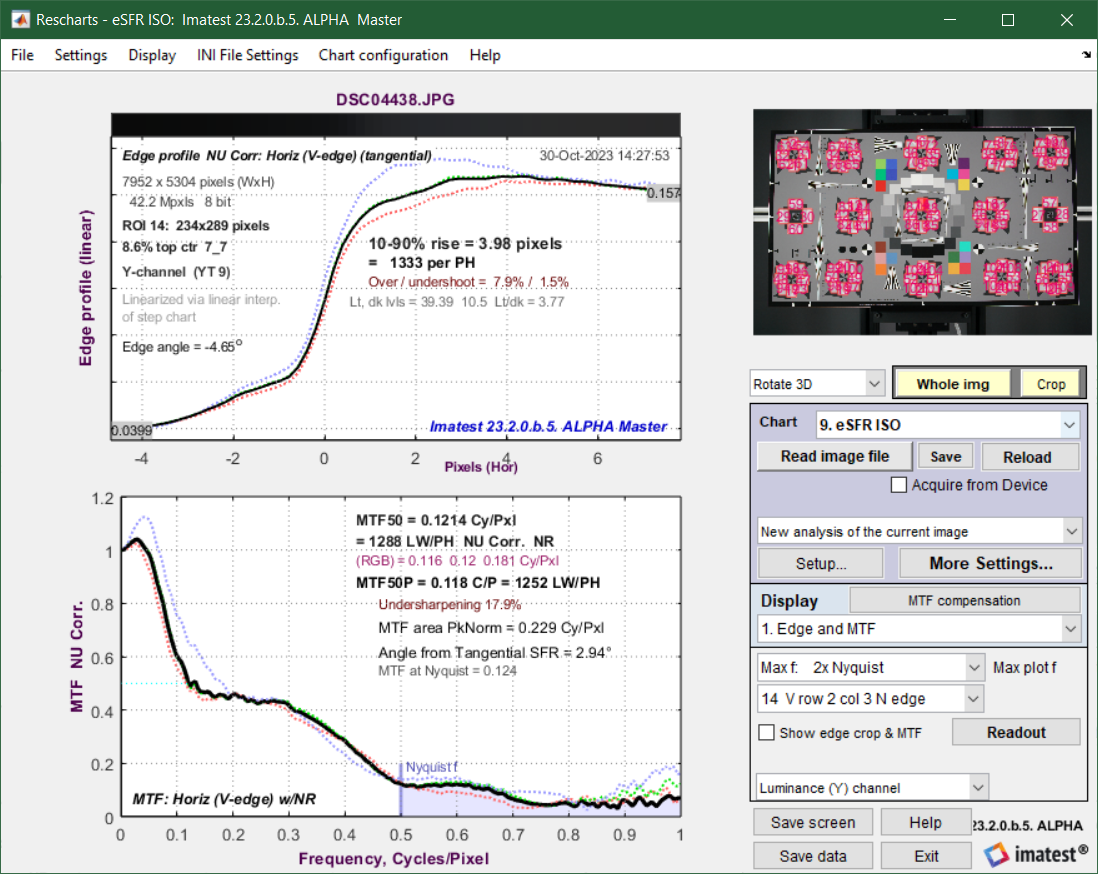


eSFR ISO test charts
Imatest E-SFR ISO 2023 test chart comes in a single variant: Extended. Additional variations will be available in the future. All variations are compliant to the ISO 12233:2023 standard.
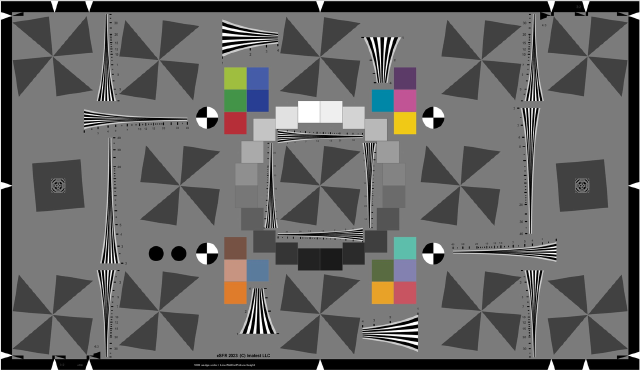
Extended E-SFR ISO 2023 test chart: 16:9 aspect ratio,
4 added stars in the corners and 2 added squares on sides,
18 added color patches, 12 pairs of added wedge patterns.
Imatest E-SFR ISO 2017 test charts come in three variants: Standard (minimal), Enhanced and Extended. All conform to the ISO 12233:2017 standard. The standard E-SFR ISO test chart, which has only features called for in the ISO standard, is shown below. Click on any of these charts for larger versions.
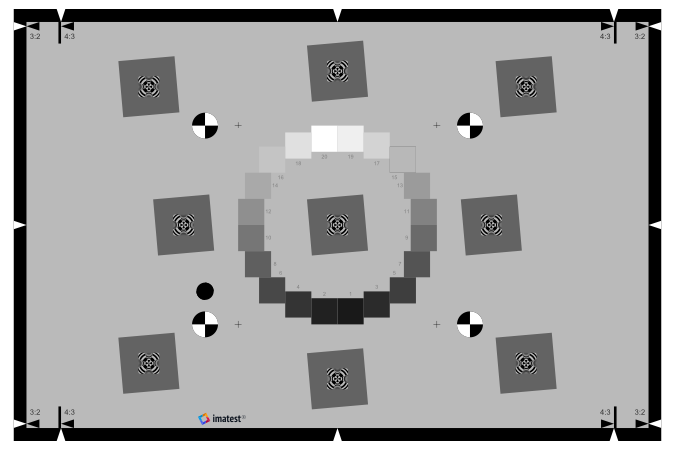 Standard (minimal) E-SFR ISO chart: 3:2 aspect ratio, no added features
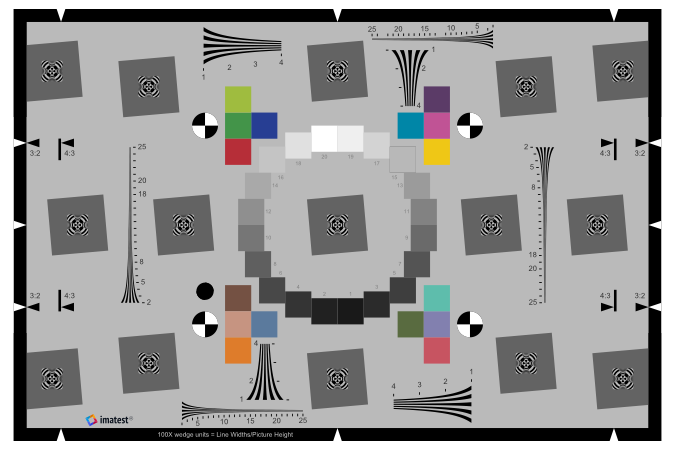
Enhanced E-SFR ISO test chart: 3:2 aspect ratio, 6 added squares on sides,
16 added color patches, four pairs of added wedge patterns. 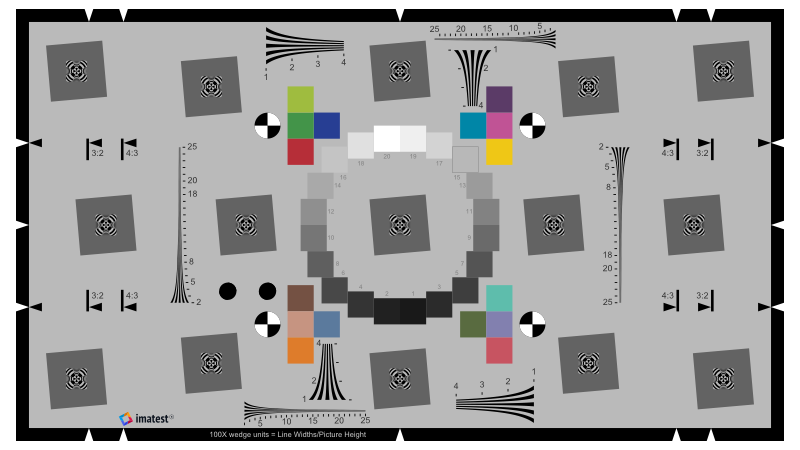
Extended E-SFR ISO test chart: 16:9 aspect ratio, 6 added squares on sides,
16 added color patches, four pairs of added wedge patterns.
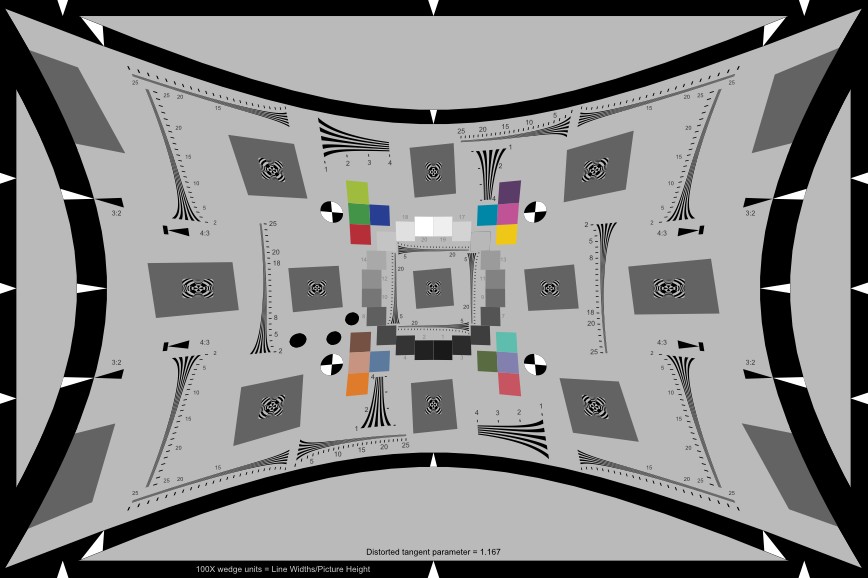 Enhanced E-SFR ISO test chart: 3:2 aspect ratio, shown with extra wedges
(4 low frequency, 16 high frequency total) and pre-distortion for use with fisheye lenses.
A great many options are available.
Sharpness is derived from light/dark slanted edges at the boundaries of the squares, as described in Sharpness: What is it and how is it measured? eSFR ISO can handle a wide range of camera aspect ratios; the left and right sides of the chart may extend beyond the frame or be well inside it.
ISO 12233:2017 Compliance
The Imatest standard (minimal) E-SFR chart is similar to the chart illustrated in the ISO 12233:2017 standard document, but with a few minor differences that maintain ISO-compliance. (We recommend the Enhancedor Extended charts.)
- There are four registration (fiduciary) marks instead of three. An additional black dot, just above the lower-left registration mark, is used to detect orientation. This change was made because the projective transformation used for automatic region detection requires four points. Annex C, Table C.1, I of the standard states, “Asymmetric features for automatic target detection. These features should be placed within the 4:3 active area aspect ratio, but may be placed for convenience as dictated by use cases.”
- The focus-aid patterns in the center of the squares are different from the patterns illustrated in the ISO standard document (which are not described in the standard): they are square (which allows more room for the slanted-edge regions used for measuring sharpness), and they have been designed to minimize interference with automatic region detection. They have no effect on measurement results.
- A 20-patch OECF gray scale pattern is used. Annex C states, “The test chart also includes grey scale patches which are used to determine the OECF. While the example chart in Figure C1 uses 16 OECF test patches; a 20 patch version as described in ISO 14524 may also be substituted.”
The Enhanced and Extended charts contain valuable features (additional squares, wedges, and color patches) in regions of the chart that are not specified by the ISO standard. These features do not violate the standard in any way.
| Chart type | Features | Notes |
| Standard (minimal) | Similar to chart illustrated in the standard document. No added features. 3:2 aspect ratio. | Cannot measure sharpness near the sides or edges of the image. Use only if required. The Enhanced or Extended charts are recommended for most purposes. |
| Enhanced | 3:2 aspect ratio. 6 added squares on sides; several added hyperbolic wedges (logarithmic wedges available on request); 16 added color patches in Imatest-produced inkjet and 8x10 inch LVT charts. | Best for 4:3 or 3:2 aspect ratios (camera phones, compact cameras, DSLRs) Includes several hyperbolic wedges with properties similar to the ISO (CIPA) visual resolution test chart which are automatically detected in the eSFR ISO module or manually selected in the Wedge module. |
| Extended | 16:9 aspect ratio. Same added features as enhanced chart. | Best for 3:2 or 16:9 aspect ratios (DSLRs, HDTV and cinema formats) |
| Options | Notes | |
|---|---|---|
| Media | Inkjet, LVT film, Photographic paper*, Chrome on Glass* | *Available in the near future: check the Imatest Store. Photographic paper charts are much finer than inkjet charts of the same size. |
| Chart aspect ratio |
3:2 (Standard & Enhanced) or | 3:2 charts (Standard and Enhanced) are well-suited for DSLRs (3:2 aspect ratio) and compact digital cameras and camera phones (4:3 aspect ratio). The 16:9 (Extended) chart is well-suited for HDTV (16:9 aspect ratio) and for DSLRs (3:2 aspect ratio). |
| Contrast | 4:1 only | 4:1 contrast is specified in the new ISO 12233:2017 standard. |
| Grayscale stepchart | Included (below center) | A 20-patch ISO 14524 circular grayscale pattern is included. |
| Color chart | 16 patches | Included in all inkjet-printed Enhanced and Extended inkjet charts (all sizes) and in LVT film charts (up to 8x10 inches) produced by Imatest. (Not be available on reflective photographic charts.) |
| Pre-distorted chart | (Standard charts are undistorted.) | Two standard levels of pincushion distortion distortion are available for use with fisheye (strongly barrel-distorted) lenses. Available in matte surface only. |
| Surface | Matte or semigloss | Semigloss is slightly sharper and has a more accurate grayscale in the deep tones (print densities > 1.75), but is more susceptible to glare (specular reflections), especially with wide angle lenses. Matte surface is recommended for wide angle lenses |
| Extra wedges | Available in all surfaces except reflective photographic | Includes several added wedges at the periphery of the chart and four near the center (inside the grayscale). |
| L*a*b* (CIELAB) D50 values | Grayscale densities (light-dark) | Patch numbering |
|
38.36 13.80 14.65 |
0.10 | 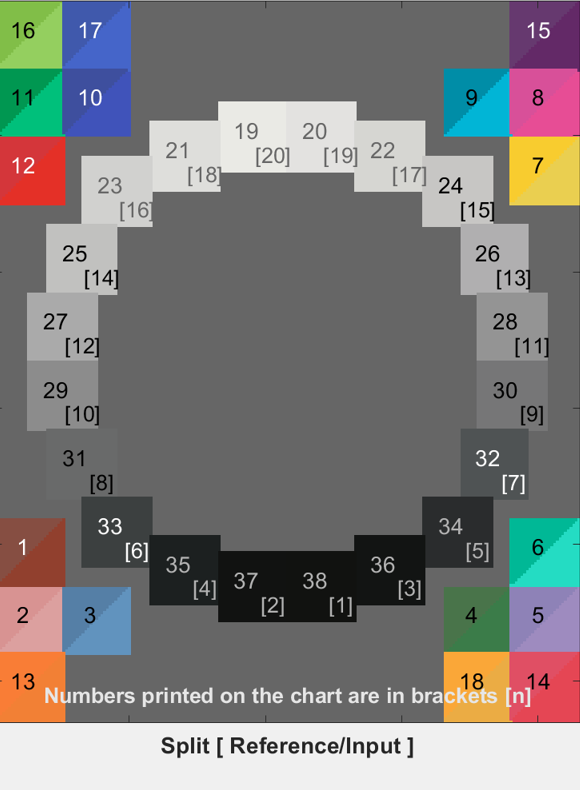 |
| *not in most eSFR ISO 2017 charts, standard for eSFR ISO 2023 charts. These are based on patches 8 and 12 in row 2 of the Colorchecker. | The printed grayscale density is limited to (a maximum of) 1.75 for matte charts. | |
Advantages of the ISO 12233:2023 Edge SFR chart over the old ISO 12233:2014/2017 chart
Advantages of the ISO 12233:2014/2017 Edge SFR chart over the old ISO 12233:2000 chart 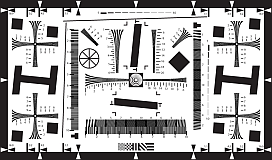 Note: the ISO 12233:2000 standard and chart, shown on the right, is referenced in the new ISO 122433:2017 standard, but is no longer an official part of the standard. The new standard specifies three charts, one of which is a slanted-edge (Edge SFR or E-SFR) chart with much lower contrast (4:1; shown on the right, below).
Compared to the SFRplus chart,
|
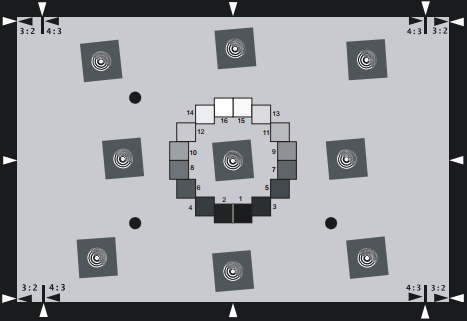
Slanted-edge algorithm The algorithms for calculating MTF/SFR were adapted from a Matlab program, sfrmat, written by Peter Burns ( ) to implement the ISO 12233:2000 standard. Imatest SFR, SFRplus, and eSFR ISO incorporates numerous improvements, including improved edge detection, better handling of lens distortion, a nicer interface, and far more detailed output. The original Matlab code is available on http://losburns.com/imaging/software/SFRedge/index.htm. In comparing sfrmat results with Imatest, note that if no OECF (tonal response curve) file is entered into sfrmat, no tonal response curve is assumed, i.e., gamma = 1 (linear response). Since the default value of gamma in Imatest is 0.5, which is typical of digital cameras, you must set gamma to 1 to obtain good agreement with sfrmat. ) to implement the ISO 12233:2000 standard. Imatest SFR, SFRplus, and eSFR ISO incorporates numerous improvements, including improved edge detection, better handling of lens distortion, a nicer interface, and far more detailed output. The original Matlab code is available on http://losburns.com/imaging/software/SFRedge/index.htm. In comparing sfrmat results with Imatest, note that if no OECF (tonal response curve) file is entered into sfrmat, no tonal response curve is assumed, i.e., gamma = 1 (linear response). Since the default value of gamma in Imatest is 0.5, which is typical of digital cameras, you must set gamma to 1 to obtain good agreement with sfrmat. |
Obtaining the chart
Summary
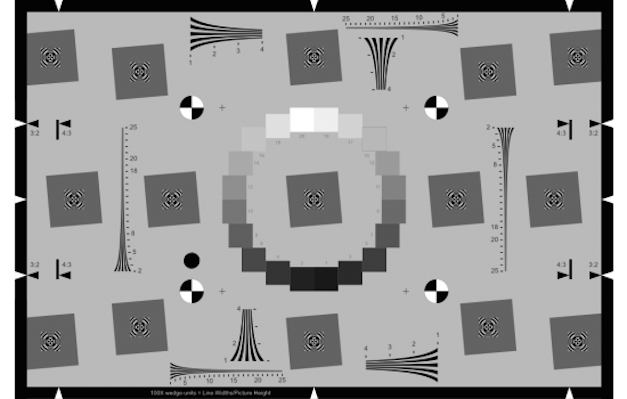
The three Edge SFR charts– Standard (minimal), Enhanced, and Extended– can be purchased from the Imatest store in a variety of media: inkjet (reflective and transmissive), LVT film (transmissive), and photographic paper (reflective; much higher resolution than inkjet charts). (For Chrome-on-Glass charts, SFRplus is often preferred because Chrome-on-Glass can't support a grayscale.) Inkjet charts can be printed on widebody inkjet printers, but you must have fine materials, skill, and a knowledge of color management. We strongly recommend that you purchase a chart.
Inkjet and photographic charts should be mounted on 32x40 or 40 x60 inch sheets of 1/2 inch (12.5 mm) thick foam board with a spray adhesive (such as 3MTM 77 or Photo Mount) or double-sided tape (such as 3MTM #568 Positionable Mounting Adhesive). 1/2 inch foam board stays flatter than standard 1/4 or 3/8 inch foam board. PVC board is also very promising: it may be more durable and it comes in a variety of sizes.
Photographing the chart.
|
Framing requirements: Ideal cropping The cropping on the right strictly conforms to the ISO standard, but is not required for practical measurements. With this cropping the calibration of the wedges will be correct (LW/PH is the printed number X 100). These numbers are not used for Imatest analysis. | 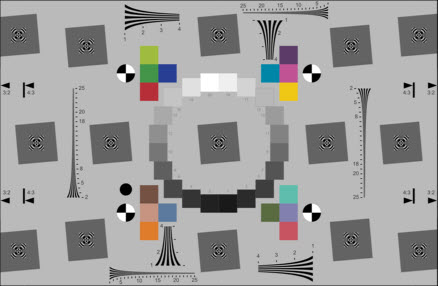 |
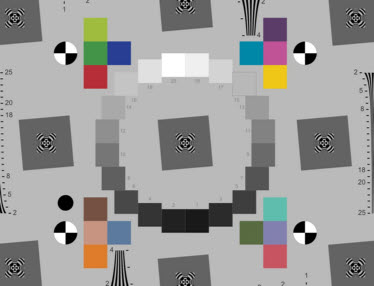 Close Cropping: The registration marks and the left and right (center row) squares should be within the image. Use SFR if you can't obtain this. Close Cropping: The registration marks and the left and right (center row) squares should be within the image. Use SFR if you can't obtain this. | 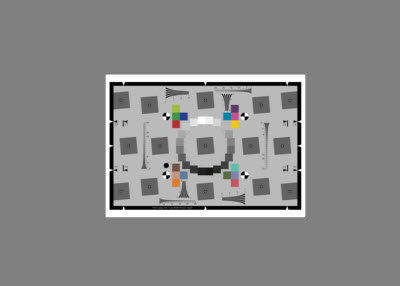 Far cropping: the chart should occupy at least half the image height. This cropping is not recommended because regions near the image boundaries are not analyzed and edges and other features may be too small to provide optimum (consistent) results with low resolution images. Far cropping: the chart should occupy at least half the image height. This cropping is not recommended because regions near the image boundaries are not analyzed and edges and other features may be too small to provide optimum (consistent) results with low resolution images. |
- The boundaries of the chart may extend beyond the image (as shown below) or be well within the image. The software is designed to accommodate a wide variety of framing and aspect ratios. Edges near the left and right boundaries will be properly located or omitted if necessary. If the sides of the chart are inside the image, you should try to minimize interfering patterns that could be mistaken for registration marks. Chart surroundings inside the image should be light to middle gray if possible. If there are problems due to the surroundings, you can crop the image in the eSFR ISO setup window.
- If possible, avoid patterns that could be mistaken for registration marks outside the chart area. In practice eSFR ISO is surprisingly robust in such situations, but it's best to keep surroundings simple, and if possible, close to neutral gray (15-25% reflectance).
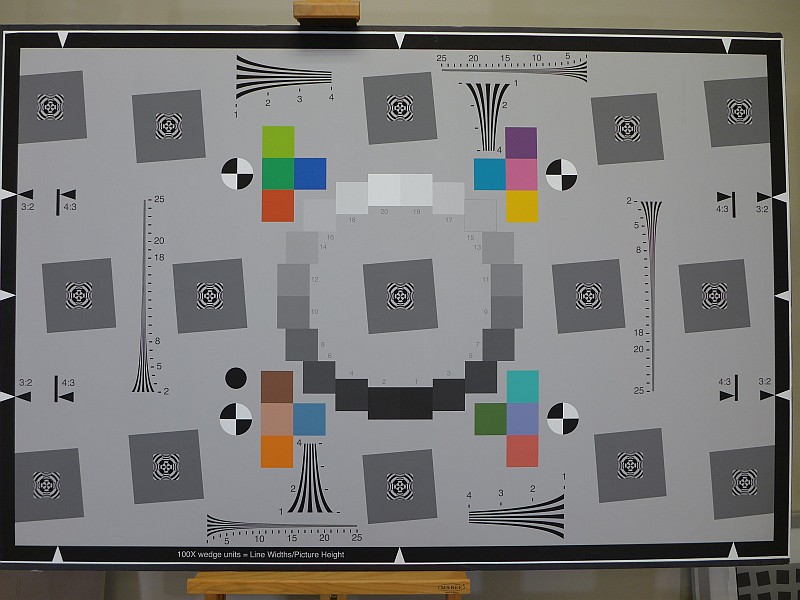 Well-framed eSFR ISO image
(though not quite perfect— a little closer would have been better)
It's OK (and quite commonplace) for the sides of the chart to run off the image.
- The chart may be aligned using techniques shown in Building a Low-Cost Test Lab. eSFR ISO tolerates moderate misalignment: a tilt of ~2 degrees, some perspective (keystone) distortion, etc., but every effort should be made to align the chart properly. Moderate barrel or pincushion distortion (<8% SMIA) is also well tolerated, but a pre-distorted chart should be used with extreme fisheye lenses (with high barrel distortion).
- The image can be cropped (starting with) to remove interfering features near the edges, using the Crop borders button in the eSFR ISO setup window.
If exposure compensation is available, increasing exposure by +1 f-stop often produces a better exposure, especially on the grayscale stepchart pattern.
Lighting
The chart below summarizes lighting considerations. The goal is even, glare-free illumination. Lighting angles between 30 and 45 degrees are ideal in most cases. At least two lights (one on each side) is recommended; four or six is better. Avoid lighting behind the camera, which can cause glare. Check for glare and lighting uniformity before you expose. A description of recommended lighting setups can be found in The Imatest Test Lab. (We formerly recommended 4700K (near-daylight) SoLux quartz-halogen lamps, but we now recommend LED lamps, which are available with adjustable intensity and color temperature.) The BK Precision 615 Light meter (Lux meter) is an outstanding low-cost instrument (about $100 USD) for measuring the intensity and uniformity of illumination.
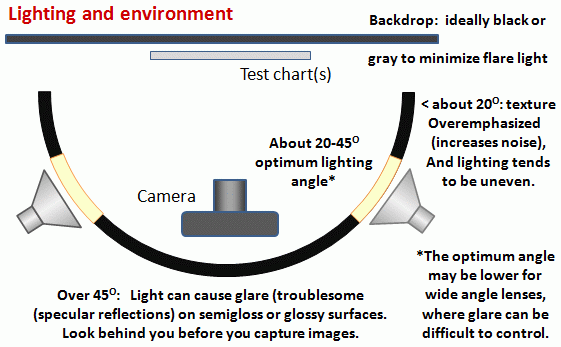 Simplified lighting diagram
Distance
Some of the material belowmay be obsolete, and we may remove them after we take a closer look. We recommend these pages.
|
Distance and field of view The camera must be far enough from the chart so you are measuring the sharpness of your camera and lens, not the chart. But remember, It's the field of view, not the chart-to-camera distance, that counts. A rough rule of thumb: For an inkjet-printed chart the field of view should be at least 24 inches (60 cm) for a 6-megapixel camera; Details below. For a high-quality photographically-printed chart (such as the charts from Applied Imaging) you can get quite a bit closer. |
A letter-sized (8.5x11 inch) chart printed on Premium Luster paper on the Epson 2200 (a high quality pigment-based inkjet photo printer) was analyzed for MTF using the 6.3 megapixel Canon EOS-10D. There was no change when the image field was at least 22 inches (56 cm) wide— twice the length of the chart. Performance fell off slowly for smaller fields.
Choose a camera-to-target distance that gives at least this image field width. The actual distance depends on the sensor size and the focal length of the lens. The minimum image field is illustrated on the right.
Cameras with more pixels, and hence higher potential resolution, should have a larger image field width, hence printed chart width.
Distance/field width guidelines for high quality inkjet charts (You can get closer with photographically-printed charts.) |
| |||||||||||||||||||||||||||||||||||||||||||||||||
| Image field width (in inches) > 8.8 × sqrt(megapixels) Image field width (in cm) > 22 × sqrt(megapixels) — or —There should be no more than 140 sensor pixels per inch of target or 55 sensor pixels per centimeter of the target. — or —The distance to the target should be at least 40X the focal length of the lens for 6-10 megapixel digital SLRs.(25X is the absolute minimum for 6 megapixel DSLRs; 40X leaves some margin.) For compact digital cameras, which have much smaller sensors, the distance should be at least 100X the actual focal length: the field of view is about the same as an SLR with comparable pixel count. The recommended distance is described in more detail in Chart quality and distance, below. | ||||||||||||||||||||||||||||||||||||||||||||||||||
| There is some confusion about lens focal lengths in compact digital cameras. They are often given as the "35mm-equivalent," which many photographers can relate to viewing angle. 35-105mm or 28-140mm are typical "35mm-equivalent" numbers, but they are not the true lens focal length, which is often omitted from the specs. What is given is the sensor size in 1/n inches, a confusing designation based on the outside diameter of long-obsolete vidicon tubes. It The table on the right relates the 1/ndesignation to the diagonal dimension of the sensor. True focal length = "35mm-equivalent" × (diagonal mm.) / 44.3 | ||||||||||||||||||||||||||||||||||||||||||||||||||
Exposure
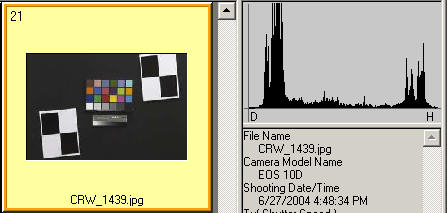
The image on the right (taken from the Canon File Viewer Utility) is close to a perfect exposure. Some exposure compensation, typically around +0.7 or +1 f-stop, is often helpful.
Good exposure is important for accurate eSFR ISO results. Neither the black nor the white regions of the chart should clip— have substantial areas that reach pixel levels 0 or 255. The best way to ensure proper exposure is to use the histogram in your digital camera. Blacks (the peaks on the left) should be above the minimum and whites (the peak(s) on the right) should be below the maximum.
| Tips on photographing the chart |
| Distance isn't critical as long as the target far enough from the camera so sharpness is limited by the camera and lens, not by the target. A Wide body printer (capable of printing images at least 24 inches high) are required to print the eSFR ISO chart. |
| The target should be evenly lit and free of glare. |
| White balance should be approximately neutral. |
| Use a sturdy tripod and a cable release. For DSLRs, use the mirror lock if possible. You can use Imatest SFR to find the difference made by a good tripod or mirror lock— to sharpen your technique, literally ( pun intended ). |
| Be sure to expose the image so detail is maintained in both light and dark areas. Neither should be blocked (clipped). Use your camera's histogram. If more than 0.5% of the pixels are at levels 0 or 255, Imatest SFR will assume that clipping has taken place and issue a warning message. This has no effect on the calculations— it's just a warning that accuracy may be compromised. |
| Be sure the camera is correctly focused on the chart. |
| Place slanted-edge images near the corners of the field as well as near the center. |
| Save the camera image as a RAW file or high quality JPEG. If you are using a RAW converter, convert to JPEG (maximum quality), TIFF, or PNG. If you are using film, develop and scan it. |
| If the folder contains meaningless camera-generated file names such as IMG_3734.jpg, IMG_3735.jpg, etc., you can change them to meaningful names that include focal length, aperture, etc., with the View/Rename Files utility, which takes advantage of EXIF data stored in each file. |
| You are now ready to run Imatest eSFR ISO. |
Links
How to Read MTF Curves by H. H. Nasse of Carl Zeiss. Excellent, thorough introduction. 33 pages long; requires patience. Has a lot of detail on the MTF curves similar to the Lens-style MTF curve in SFRplus. Even more detail in Part II. Their (optical) MTF Tester K8 is of some interest.
Understanding MTF from Luminous Landscape.com has a much shorter introduction.
Understanding image sharpness and MTF A multi-part series by the author of Imatest, mostly written prior to Imatest's founding. Moderately technical.
Slanted-Edge MTF for Digital Camera and Scanner Analysis by Peter D. Burns (2000) (alternate source). An excellent introduction to the ISO 12233 slanted-edge measurement. Closely related: Diagnostics for Digital Capture using MTF by Don Williams and Peter D. Burns (2001), Applying and Extending ISO/TC42 Digital Camera Resolution Standards to Mobile Imaging Products by Don Williams and Peter D. Burns (2007) (Contains an image of an early version of the low-contrast slanted-edge test chart proposed for the revised ISO 12233 standard.)
Bob Atkins has an excellent introduction to MTF and SQF. SQF (subjective quality factor) is a measure of perceived print sharpness that incorporates the contrast sensitivity function (CSF) of the human eye. It will be added to Imatest Master in late October 2006.
Optikos makes instruments for measuring lens MTF. Their 64 page PDF document, How to Measure MTF and other Properties of Lenses, is of particular interest.