Gamutvision main page - Gamutvision Table of Contents/Site map - Using Gamutvision - Using Gamutvision 2: Displays
Gamut volume - Light and color - Color models - HSV and HSL
Color difference equations (varieties of ΔE and ΔE) are in Colorcheck/Color/Tone Appendix.
Gamut volume algorithm
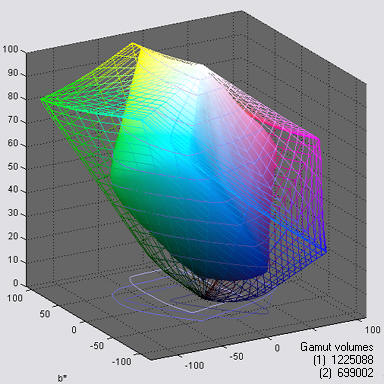 L*a*b* Gamut volume is the best single number for characterizing the color response of a device or color space profile. L*a*b* gamuts and volumes are shown on the right for Adobe RGB (1998) color space (wireframe) and the Epson R2400, Premium Luster (solid), mapped from Adobe RGB with perceptual rendering intent. The units of L*a*b* volume are sometimes labelled ΔE3 (referring to ΔE*ab, above).
Gamut volume is not easy to calculate: it can't be directly extracted from the profile. The Gamutvision algorithm calculates the gamut volume from an image containing all values of HSL Hue H and Lightness L for a fixed value of Saturation S (usually the maximum value, S = 1), illustrated on the right and in Gamutvision Structure (on the left). This image is used to generate the gamuts on the right. The algorithm is as follows.
- Map the RGB image values into L*a*b*.
- Find the "center of mass" of the gamut. This is typically in the neighborhood of L* = 55, a* = b* = 0.
- Convert the values into cylindrical coordinates (R, Θ, Φ) with origin at the center of mass.
- Create a "binning" array representing uniformly spaced longitudinal and latitudinal angles (Θ and Φ, spaced δΘ and δΦ).
- Place the average radius (R) corresponding to each image point in the appropriate binning array element.
- Interpolate to fill the missing points.
- Sum the volumes for each array entry to find the total volume V = ∑δV, where
δV = R2 δh δΘ / 3 ; δh = R cos(Φ) δΦ ; δV = R3 cos(Φ) δΘ δΦ / 3 (ΔE3 units)
The color space gamuts calculated by this algorithm are about 1% higher than than the volumes reported by Bruce Lindbloom, except for extremely large gamut spaces (ProPhoto, WideGamut) which contain a* and b* values larger than the Gamutvision limits of �128.
Light and Color
This section reviews the basic concepts of additive and subtractive color. If you are familiar with them, you may want to skip to Color models section, below. Color theory is dealt with in more depth in the series on Color management.
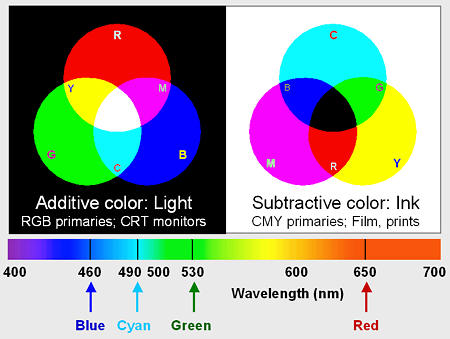 The human eye is sensitive to electromagnetic radiation with wavelengths between about 380 and 700 nanometers. This radiation is known as light. The visible spectrum is illustrated on the right. The eye has three classes of color-sensitive light receptors called cones, which respond roughly to red, blue and green light (around 650, 530 and 460 nm, respectively). A range of colors can be reproduced by one of two complimentary approaches:
- Additive color: Combine light sources, starting with darkness (black). The additive primary colors are red (R), green (G), and blue (B). Adding R and G light makes yellow (Y). Similarly, G + B = cyan (C) and R + B = magenta (M). Combining all three additive primaries makes white.
- Subtractive color: Illuminate objects that contain dyes or pigments that remove portions of the visible spectrum. The objects may either transmit light (transparencies) or reflect light (paper, for example). The subtractive primaries are C, M and Y. Cyan absorbs red; hence C is sometimes called "minus red" (-R). Similarly, M is -G and Y is -B. The two approaches are illustrated on the right and described in the table below.
Unfortunately, ideal C, Y and M inks don't exist; the subtractive primaries don't entirely remove their compliments (R, B and G). This isn't a problem for film, where light is transmitted through three separate dye layers, but it has important consequences for prints made with ink on reflective media (i.e., paper). Combining C, Y and M usually produces a muddy brown. Black ink (K) must added to the mix to obtain deep black tones. CMYK color is highly device dependent-- there are many algorithms for converting RGB to CMYK. Photographic editing should be done in RGB) color spaces. Conversion to CMYK (usually with colors added to extend the printer color gamut) should be left to the printer driver software.
|
You can obtain a wide range of colors, but not all the colors the eye can see, by combining RGB light. The gamut of colors a device can reproduce depends on the spectrum of the primaries, which can be far from ideal. To complicate matters, the eye's response doesn't correspond exactly to R, G and B, as commonly defined (the description above is oversimplified). Device color gamut and the eye's response are discussed in detail in the page on Color Management.
Color models
If you lighten or darken color images you need to understand how color is represented. Unfortunately there are several models for representing color. The first two should be familiar; the latter two may be new.
- RGB - Red, Green, Blue; The additive primary colors. Used for monitor screens and most image file formats. There are actually a number of RGB color spaces-- sRBG, Adobe RGB 1998, Bruce RGB, Chrome 2000, etc.-- differing from each other in the purity of their primary colors, which affects their gamut-- they range of colors they represent. They are discussed in Color Management.
- CMY(K) - Cyan, Magenta, Yellow; The subtractive primary colors: the compliments of the additive primaries (Cyan is -red; magenta is -green; yellow is -blue.) Widely used in inks for printing with black (K) added because C, M, and Y pigments and inks rarely give deep, rich black tones by themselves (they tend to make a muddy brown). CMYK is important to the prepress industry, but most photographers don't need to be concerned with it. Most high quality photographic printers have additional inks (light M, light C and gray may be added to the basic four), so they aren't really CMYK; the printer driver software converts RGB files into ink densities.
- HSV - Hue, Saturation, Value. Hue is what we perceive as color. S is saturation: 100% is a pure color. 0% is a shade of gray. Value is related to brightness. HSV and HSL (below) are obtained by mathematically transforming RGB. HSV is the identical to HSB.
- HSL - Hue, Saturation, Lightness. H is the same as in HSV but L and V are defined differently. S is similar for dark colors but quite different for light colors. Also called HLS.
It is not practical to use RGB or CMY(K) to adjust brightness or color saturation because each of the three color channels would have to be changed, and changing them by the same amount to adjust brightness would usually shift the color (hue). HSV and HSL are practical for editing because the software only needs to change V, L, or S. Image editing software typically transforms RGB data into one of these representations, performs the adjustment, then transforms the data back to RGB. You need to know which color model is used because the effects on saturation are very different.
|
HSV color is shown here in an illustration from Jonathan Sachs' tutorial, "The Basics of Digital Images" (right click on the link to save it in Adobe PDF format). V = max(R,G,B). Maximum Value (V = 1 or 100%) corresponds to pure white (R=G=B=1) and to any fully saturated color (at least one RGB value at 1 and one at 0; no gray component (W = min(R,G,B)). V = 0 is pure black, regardless of H and S. The HSV color model can be depicted as a cone, widest at the top (V = 1), coming to a point at the bottom (V = 0; pure black). (I use the "V"-like appearance of the cone as a mnemonic to remember "HSV." The names of the color models are pretty arbitrary.) efg has a technically detailed explanation of the HSV color model, complete with a Java applet. | 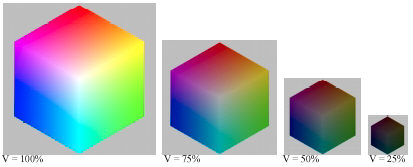 |
|
HSL color. Maximum color saturation takes place at L = 0.5 (50%). L = 0 is pure black and L = 1 (100%) is pure white, regardless of H or S. The HSL color model can be depicted as a double cone, widest at the middle (L = 0.5), coming to points at the top (L = 1; pure white) and bottom (L = 0; pure black). | 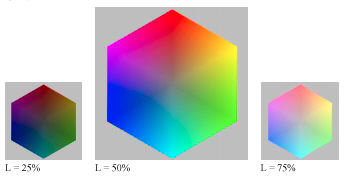 |
Now the important part. What you must remember about the HSV and HSL color models is,
| Darkening in HSV reduces saturation. | Darkening in HSL increases saturation when L > 0.5. | |||
| Lightening in HSV increases saturation. | Lightening in HSL reduces saturation when L > 0.5. | |||
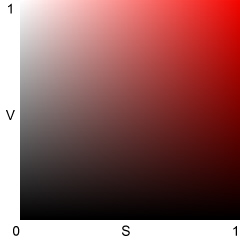 HSV Best representation of saturation | 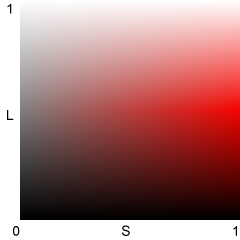 HSL Best representation of lightness |
HSV and HSL were developed to represent colors in systems with limited dynamic range (pixel levels 0-255 for 24-bit color). The limitation forces a compromise. HSV represents saturation much better than brightness: V = 1 can be a pure primary color or pure white; hence "Value" is a poor representation of brightness. HSL represents brightness much better than saturation: L = 1 is always pure white, but when L > 0.5, colors with S = 1 contain white, hence aren't completely saturated. In both models, hue H is unchanged when L, V, or S are adjusted.
HSV and HSL are illustrated above for red (H = 0). S varies from 0 to 1 along the horizontal axis; V and L vary from 0 to 1 along the vertical axis. The right side of the HSV illustration (S = 1) always has maximum saturation (G = B = 0) but the top (V = 1) varies from pure white at S = 0 to pure red at S = 1. The top of the HSL illustration (L = 1) is pure white for all values of S. It would be nice to be able to represent brightness and saturation properly in one system, but you can't have it both ways.
HSV and HSL equations
Hue H is the same for HSV and HSL. The full equations are in efg's HSV lab report. Expressed in degrees (0-360�) for any nonzero x, H = 0 for Red (x,0,0); 60� for Yellow (x,x,0), 120� for Green (0,x,0) (illustrated below), 180� for Cyan (0,x,x), 240� for Blue (0,0,x), and 300� for Magenta (x,0,x). H can also be represented on a scale of 0 to 1.
Assume R, G, and B can have values between 0 and 1. Let W = min(R,G,B) = the gray component.
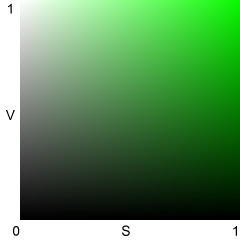
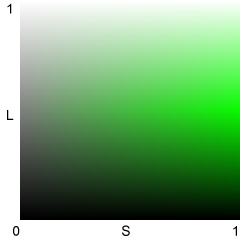
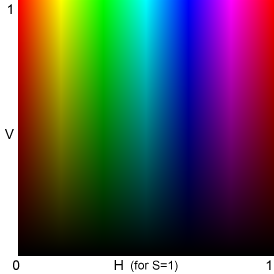
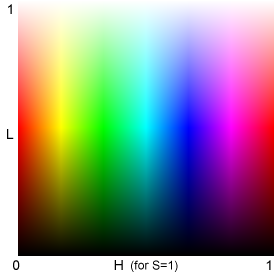
| Some interesting relationships (1) For W = min(R,G,B) = 0 (no gray; maximum saturation), SHSL = SHSV = 1 ; L = V / 2 ; L <= 0.5. (2) For V = max(R,G,B) = 1 and SHSL = 1, L = 1-(SHSV / 2) ; SHSV = (1-L) / 2; L >= 0.5 |
| These relationships imply that (1) the bottom half of the HSL L-H plot for S = 1 (above, right) is identical to the HSV V-H plot for S = 1 (above, left), and (2) the top half of the HSL S-H plot is identical to an HSV S-H plot for V=1 (not shown), i.e., the HSL L-H plot (above, right) combines two HSV plots. |
All saturation equations have V-W in the numerator; they differ in denominator scaling. In both representations, S is a measure of relative saturation. S is 0 when W = V (R = G = B; neutral gray); S = 1 when W is at its minimum allowable value for a given value of V or L. For HSV, W = 0 when S = 1.
For HSL with L <= 0.5, maximum saturation takes place when W = 0; SHSL = (V-W) / (V+W) = 1. When L > 0.5, W must be greater than 0. Maximum saturation takes place when W = 2L-V takes its minimum value, Wmin. In this case V = 1, so Wmin = 2L-1. SHSL = (V-W) / (2-V-W) = (1-2L+1) / (2-1-2L+1) = 1.
V and L don't correspond with perceived luminance; for example, blue and gray or white with the same V or L values would have very different luminance. The PAL luminance signal, Y = 0.30R + 0.59G + 0.11B, corresponds more closely to perceived luminance.