Documentation - Current v26.1

Index of the Table of Contents
Image Quality IQ factors (KPIs) measured by Imatest, with links to detailed descriptions and instructions.
Sharpness Introductions to sharpness and sharpening; comparisons of different charts; chart quality limitations & how to overcome them
Other IQ factors  Noise, SNR, Temporal noise, Dynamic Range (DR),  Chromatic Aberrations, Distortion, Veiling glare, etc.
Information metrics  Shannon information capacity, SNRi, and related image information metrics
Getting started Why Imatest?, Test charts, Lighting, Image capture technique, Setting up your lab, Using Imatest software
Start using Imatest software Installation, Using Imatest, Image file formats & devices, Activation/Deactivation
General InstructionsSpecial standards, Supported devices, Test manager, Raw files, Test lab, INI files, Pass/Fail Monitor
Output DocumentationDescriptions of selected JSON, CSV and XML outputs
Acquiring imagesFiles, formats, devices, and utilities for acquiring images
Knowledge Base highlights Links to articles for troubleshooting, activation, and general advice on operation.
Troubleshooting What to do when Imatest doesn't work as expected
Simatest Camera/ISP Simulator Simatest – Image Signal Processing / Camera Simulator – examples – Image sensor noise 
IQ Utilities SSIM, Image Statistics, Radial geometry 
Slanted-Edge sharpness modules SFR (manual ROIs), SFRplus, eSFR ISO, SFRreg, Checkerboard (auto ROI detection)
The four auto-detection slanted-edge sharpness module are compared here.
Other sharpness modules Log F-Contrast, Star, Random/Dead Leaves/Spilled coins, Wedge, Sharpness utilities & postprocessors
Sharpness utilities & postprocessorsMTF Compare, Image stabilization, Batchview, Find ShGarpest Files
Tone, Color, Noise & Dynamic Range modules Color/Tone (Interactive & Auto), CCM (Color Correction Matrix), CDP, Contrast Resolution, Colorcheck, Stepchart, Measuring patches, Gamutvision for evaluating ICC color profiles and gamut mapping.
Spatial & Flat field modules Flatfield, Flatfield Interactive, Distortion, Dot pattern, Testing displays
Miscellaneous modules and utilities Lighting Control, Arbitrary charts, Device Manager, Auto White Balance/Exposure/Focus (AWB, AE, AF), Printing & displaying test charts, Rename Files, Educational Apps, Database
Industrial Testing edition  Modules, Instructions for various interfaces (EXE, C, C++, Python, .NET), INI file reference, Pass/Fail, Operator Console, Speedup
AppendixFAQ, Versions, Troubleshooting, Change Log, INI file reference, License

Image Quality

General — Introduction to Image Quality Factors (Key Performance Indicators – KPIs)

Image quality factors – Overview and Imatest measurements Recommended for getting started.

Introduction - Summary table - Image quality factors - Sharpness - Texture - Noise - Information capacity and metrics - Tonal response - Dynamic range - Color accuracy - Distortion - Uniformity - Blemishes - Exposure accuracy/ISO sensitivity - Lateral chromatic aberration - Stray light (flare) - Veiling glare - Color moiré - Software artifacts - Data compression - Printer quality factors

Sharpness
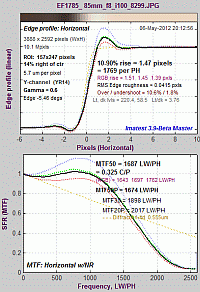
Sharpness - What is it and how is it measured?

Introduction - MTF - MTF equation - Spatial frequency units - Summary metrics- MTF measurement matrix - comparing measurement techniques - Slanted-Edge measurements - Why a slanted edge? - Clipping - Noise reduction - Interpreting MTF50 - AutoFocus (AF) Speed - Calculation details - Slanted-edge algorithm - Imatest vs. ISO calculation - Links

Sharpening - and Standardized Sharpening for comparing cameras

Introduction - Examples - Oversharpening/Undersharpening - Examples - Unsharp masking (USM) - Links - Standardized sharpening

Comparing sharpness in different cameras - The application: "Image-centric" (for pictorial images) or "object-centric" (for medical, machine vision, etc.) strongly affects how images are compared.

Validating the Imatest slanted-edge calculation

Slanted-edge versus Siemens Star - A comparison of sensitivity to signal processing

Introduction - Images - Raw results - Slanted-edge results - Sinusoidal (Log F-Contrast and Siemens star) results - Extreme sharpening - Summary - Conclusions

Slanted-edge versus Siemens Star, Part 2 - Results for four additional cameras

Slanted edge vs. Siemens star MTF calculations: 2024 white paper 

Slanted-edge measurement consistency and repeatability - comparing different ISO speeds and ROI sizes. Incomplete, but still useful.

Nyquist frequency, aliasing, and Color Moire - introducing a color aliasing metric derived from wedges.

Diffraction, optimum aperture, and defocus - Lens aberrations – Diffraction – Pixel response limits and Q – Defocus 

Display (Monitor) Sharpness - Display the chart - Capture the image - Analyze - Results - TV Lines - Monitor gamma - CMS systems

Camera Monitor Systems (CMS) – for automotive mirror replacement systems and some endoscopes

LSF (Line Spread Function) correction factor for slanted-edge MTF measurements

Correcting nonuniform illumination in slanted-edge MTF measurements for nonuniformity perpendicular to the edge

Compensating camera MTF measurements for chart and sensor MTF

Introduction - Calculation - MTF compensation files - Applying the compensation - Sensor MTF compensation for measuring lens MTF - Chart MTF measurements

Chart Quality Calculator - determine the suitability of a chart (based on MTF measurements for specific media & print methods) for a specific application. Somewhat complex to learn. We recommend Test chart suitability, below.
Test chart suitability for MTF measurements - charts for determining the MTF measurement suitability of several media types (inkjet and photographic; reflective and transmissive). Based on Chart Quality Calculator results.
Implicit sharpness assumption (diffraction) - Chart suitability display - Inkjet matte - B&W photo paper - Color LVT | B&W LVT - MTF suitability calculations 
Reflective Chart Quality Comparison: Inkjet vs. Photographic
Transmissive Chart Quality Comparison
MTF curves and Image appearance - Correlating measurement with appearance
Introduction - The Slanted-edge test - Reference image - Sharpened images - Blurred images - Sharpened + blurred images - Observations - Sharpness ranking - Links
Acutance and SQF (Subjective Quality Factor): perceptual sharpness measurement
Introduction - Acutance and MTF - Meaning of Acutance & SQF - Measuring Acutance & SQF - The SQF equation - CSF - Links
 

Other Image Quality Factors

Gamma, Tonal Response, and related concepts – why it’s used, how to measure it, and much more
Introduction – Encoding vs. Display gamma – Why logarithms? – How gamma-encoding increases Dynamic Range  – Expected gamma values – Gamma and MTF – Which patches are used to calculate gamma? – Why gamma ≅ 2.2? – Tone mapping – Contrast: ratio, Weber, Michelson – Logarithmic color spaces – Monitor gamma
Noise in photographic images 
Introduction - Nonuniformity correction - Measurements - SNR_BW - Appearance - Summary - F-stop noise, Scene-referenced SNR & Dynamic Range - Temporal noise - ISO 15739  - The mathematics of noise - Raw vs. demosaiced noise - Spectrum - Links
Temporal Noise - comparing the two-image and multi-image measurements
Dynamic Range - a general introduction with links to Imatest modules that calculate it.
Sensor vs. System DR – Flare, Charts, Exposure – DR definitions – Transmissive chart – Lightbox – How to measure DR – Minimizing reflections – Contrast Resolution chart – Tips and recommendations – Offsets – More on Flare – Flare light – limited DR – F-stop noise & scene-referenced SNR
Chromatic Aberration - (Lateral Chromatic Aberration) AKA Color fringing
Introduction - Measurement - Demosaicing - Correction for non-tangential edges - Purple fringing
Distortion - Methods and Modules   Distortion formulas - Modules - TV Distortion and Field of View - Compare results
Three Optical Centers – Centers of sharpness, illumination, and distortion

Stray light (flare) 

Introduction - Outputs -  Examples - Causes - Test overview - Test factors - Master and IT instructions - Normalized stray light instructions - Settings - Calculations - Normalization methods - Light source mask methods 
Veiling glare
Introduction - Target - Stepchart measurement - Results - ISO 9358 - ISO 18844 measurements with Uniformity - Contrast Resolution two exposure method 
Color correction matrix
Introduction - Math - Color/Tone Interactive - Saturation - Applying the matrix 
ISO Sensitivity and Exposure Index
Introduction – Incident light measurement – Modules – Equations – Raw files – Saturation-Based  –  Standard Output  –  Related documents 
 

Information metrics: 

Solutions - Image Information Metrics contains a concise introduction to the new metrics, as well as news, video, and links.

Image information metrics from slanted edges, (Electronic Imaging 2024) is an excellent technical introduction to the new metrics.

White papers

Image quality testing based on information metrics (2026) is a concise guide/short course for camera image quality testing, primarily for machine vision, focusing on the new metrics derived from information theory, which are highly preictive of camera performance. Not overly technical. Highly recommended

Introduction to Image Information Metrics (12/2023) is a concise introduction to image information capacity and related metrics, with minimal equations and technical detail.

Image Information Metrics and Applications: Reference (12/2023) (41 pages) has all the equations and technical detail. It's the reference for the shorter documents.

The Siemens star method, introduced in 2020, is slower but better for observing the effects of image processing artifacts (demosaicing, data compression, etc.).

Information-based Dynamic Range - Part 1: Introduction - Part 2: Using InfoDR - Part 3: Results
Shannon information capacity from Siemens stars (2020) - a figure of merit that combines sharpness and noise
Meaning - Results - Summary
Information capacity measurements from Slanted edges: Equations and Algorithms (2023-4) - figures of merit that combine sharpness and noise, conveniently measured from any slanted-edge, including NPS, NEQ, and SNRi. 
Information capacity measurements from Slanted edges: Instructions (2023-4) - instructions on the new calculations.

Getting Started with Image Quality Testing

Why Imatest?   |   Test Charts   |   Lighting   |   Image Capture Technique   |   Setting up Your Lab   |   Using Imatest Software 
Sample images for several modules from Github

Start Using Imatest Software

Installation - and getting started
Install - Purchase - Register - Offline registration - Files
Using Imatest - Getting started - Introduction and general instructions  Recommended for beginners.
The Imatest workflow – Selecting the chart and module – Running Imatest – Finding Imatest Help – Imatest main window  – Window and font size – Three helpful buttons – Raw files – Misc. controls and utilities – EXIF display – ROI Options – Options II – EXIF data settings – Dropdown menus – Figures – CSV & JSON output – License – Tips for successful testing  
Image quality testing based on information metrics
Image file formats and acquisition devices - Imatest's many image sources - What to do if an image file fails to read  correctly
Standard (interchangeable) image files - YUV & more - Raw files - Video files - Acquisition devices for Imatest
Supported image acquisition hardware for Imatest Image Master
Fixed versus interactive modules 
Activation/Deactivation - Activating Imatest and moving it from one computer to another
Online Activation | Offline Activation | Online Deactivation | Offline Deactivation | Floating Licenses | Proxy Server
Knowledge base — contains several links to help solve activation issues.

Imatest Instructions – general

Session Logging - Log level controls for display and log files
Target Detection Settings - Settings for guiding automatic detection of targets if default detection fails.
Checkerboard - SFRreg
Skype video specification support - Instructions and suggestions
IEEE CPIQ (Camera Phone Image Quality) Support
SFR & Acutance - Color Uniformity - Distortion & Chromatic Aberration - Texture
Building a test lab - How to build a testing lab
Introduction - Hardware - Building a Low-Cost Test Lab - Easel - Light measurement - Tripod - Clamps - Putting it together - Targets - Aligning target & camera 
Saving and retrieving Regions of Interest (ROIs) -  How to save and retrieve ROIs in named files for future use.
Saved settings - Imatest-v2.ini and INI files for use with Imatest IT
imatest-v2.ini - INI file utilities - INI file editor - Creating custom icons - Locking settings 
Pass/Fail Monitor - Realtime display and update of pass/fail results (useful with Imatest IT)
Introduction - Setup - Utilities

Output Documentation

Embedded output documentation for Sharpness and Distortion modules
Output documentation Google spreadsheet
Output documentation Excel spreadsheet
Results from Stray Light and Concentric Rings

Acquiring images - Files, formats, devices, and utilities

Device Manager - Connect to cameras, adjust settings and acquire images into interactive modules.
Supported image acquisition hardware for Imatest Image Master
Using Direct Image Acquisition - Acquiring images directly from devices
ON Semi Devware Quickstart for direct image acquisition
Omnivision Quickstart for direct image acquisition
Android Camera Interface for direct image acquisition
Sony AYA Interface for direct image acquisition
On Semi DevWareX Interface for direct image acquisitionf
Test Manager
Autobatch - Combine several test images (from different modules) for a single device into an automatic batch run.
The Imatest Functional Interface - A simplified interface for running tests with consistent settings
The Functional Interface - The Editor - Preparing a merge file with the INI editor  (may be deprecated in a future release)
Raw files - Imatest modules can analyze raw files directly or after demosaicing.
Introduction - Using raw files - Bayer raw and RCCC files - LibRaw demosaicing (for commercial raw files) - Bayer frequency units - DNG files - Rawview utility - Generalized Read Raw (for binary raw files) - Decompanding - Creating synthetic raw images
 

Knowledge Base highlights - Links to articles for troubleshooting, activation, and general advice on operation.

A module that formerly worked has stopped working
How to store and retrieve region (ROI) selections 
New 2019 Imatest Licensing – Update Required to Activate
There are many more links like these on the full Knowledge Base.
 
Troubleshooting - What to do when Imatest doesn't work
Reporting a crash - Do this first - Installation problems - Version 3.6+ changes - Problems after install - Missing DLLs - Runtime problems - Corrupted INI file - A module has stopped working - Error reporting - Command (DOS) window - Diagnostics runs - Path conflicts

Simatest ISP/Camera simulator

Simatest:  Overview - Compact introduction to the Simatest Camera/Image Signal Processing (ISP) Simulator:  shows how image sensor noise and most common ISP blocks affect appearance and measurements.  Available in the Imatest Pilot program, starting February 2025.
Introduction – Block diagram – Input files – Running Simatest – Settings – Image processing blocks – Results – Side-by-side view – Benefits of Simatest – Low Light analysis – Appendix: Image sensor noise model
Simatest: instructions and reference - Full reference for Simatest ISP/Camera simulation 
Input files – Opening Simatest – Settings – Image processing blocks – Sharpening – Image sensor noise – Running Simatest – Processing – Side-by-side view – Results – Controls – OCR – Face and People Detection 
Simatest examples - Examples of using Simatest to measure image sensor noise and model camera and ISP performance
Simatest block diagram –  Modeling image sensor noise – Measuring the noise – Simulating the noise – Modeling and measuring image sharpness – Simulating image sharpness – Simulating camera JPEGs
Image Sensor Noise – measurement and modeling –- using raw files for measuring Dynamic Range and noise for Simatest
Image Processing (legacy module – superseded by Simatest) – Simulate image processing operations (degradations & enhancements) and observe their effects on appearance and measurements – Operation - Image processing blocks - Displays and analysis - OCR - Face & People Detection

Image quality utilities degrade, enhance, examine, or analyze any image (not just test charts)

SSIM: Structural Similarity Index - Measure image quality degradation and artifacts from signal processing such as compression. Also, measure PSNR.
Operation - Options
Image Statistics - Interactively observe image statistics: cross sections, means, noise, SNR, histograms, and frequency spectra.
Radial Geometry - Add or correct distortion, lateral chromatic aberration, or rotation to images.

Slanted-Edge sharpness modules

SFR – Basic analysis of slanted-edges (manual ROI selection)
Using SFR Part 1 - Setting up and photographing SFR targets
Slanted-edge test - Print chart - Lighting - Distance - Exposure - Tips - Quality and Distance
Using SFR Part 2 - Running Imatest SFR
Image file - ROI - Cropping recommendations (ROI size) - Additional input - Secondary Readout - Equations - Gamma - Warnings - Saving - Repeated runs - Excel CSV output
Imatest SFR LCD target
Screen Patterns module - Web pattern
SFR results: MTF (Sharpness) plot
SFR results: - Chromatic Aberration, Noise, and Shannon capacity plot
SFR results: Multiple ROI (Region of Interest) plot
2D Summary plot - 1D Summary plot - CSV Output file - Summary explanation - Excel plots

SFR results: Auto Focus (AF) plot


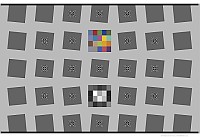
Table of slanted-edge MTF modules with automatic region detection  (interactively or as Auto (batch) analyses)
All support ISO-compliant MTF (sharpness) analysis, Lateral Chromatic Aberration (LCA), and information capacity for chart contrast ratios between 2:1 and 10:1, with the ISO-standard 4:1 preferred.
FeatureSFRplus
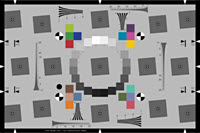
eSFR ISO
eSFRiso_enhanced_200W
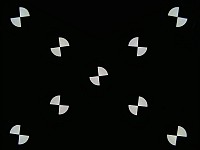
SFRreg
Optikos_Meridian_200W
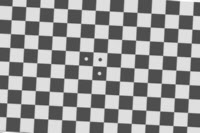
Checkerboard
checkerboard_ideal_framing-200W
Sharpness map detail  High  Medium  Depends on arrangement  High
ISO-standard chart design–♦––
Color analysis♦♦  (only for SFRreg center chart)–
Tonal response (OECF)♦♦  (only for SFRreg center chart)–
Noise analysis  Limited♦  Limited  Limited
Distortion♦ Good  Limited–♦ Best
Geometry (rotation,
FoV, keystone, etc.)
♦♦–♦
Features and
recommended uses
Imatest's original automatically-detected chart, in use since 2009. Robust and versatile. Some white space recommended above and below top and bottom bars. More spatial and distortion detail than eSFR ISO.
ISO-standard chart design. Includes wedge analysis and (optional) color patches. Supports detailed noise analysis.

Several individual charts are typically placed around the image field. For
- extreme fisheye lenses (>180º)
- target projection systems
- Charts at different distances to test focus & depth of field.
- extreme high resolution cameras (>36MP)

Relatively insensitive to framing: can zoom in or out as long as distance is large enough so chart quality is not an issue and there are detectable corners. Well-suited for through-focus measurements. Very accurate distortion measurements.

♦ denotes strong support;  – denotes no support.

SFRplus – Automated analysis of slanted-edges
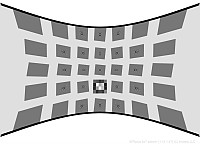
Using SFRplus Part 1 - The SFRplus chart: features and how to photograph it
Slanted-edge test - Advantages - Obtain chart - Framing - No bars - Lighting - Distance - Exposure - Tips - Links
Using SFRplus Part 2 - Running SFRplus
Selecting files – Setup window – ROI selection & analysis area - Edge ID Files - Speeding up runs - More settings window – Secondary Readout – Settings area – Gamma – Chart contrast ratio – Auto mode window – Warnings - Clipping – Summary
Slanted-edge results Part 3 - SFRplus edge results
Multi-ROI summary – Edge and MTF – Chromatic Aberration – Acutance/SQF – Histograms & noise – Image, Geometry, Distortion, FoV – 3D Plots – Lens style MTF plot – Edge roughness – Point Spread Function – Summary – CSV & JSON output
Slanted-edge results Part 4 - SFRplus other results (tones, color, distortion, etc.)
Tonal response and gamma - Image, Geometry, Distortion, FoV - Radial distortion - Summary and EXIF data - Color analysis - Detailed noise plot - Summary - Links
sfrplus_predistort_200WPre-distorted and special charts for Fisheye Lenses - with many applications such as automotive rear view cameras
              Includes SFRplus, eSFR ISO, and SFRreg charts.  Previewing pre-distortion
SFRplus Distortion and Field of View measurements
Introduction - Pre-distorted charts - Running SFRplus & Algorithm - Results - Distortion correction display - Radial plot
How to Test Lenses with SFRplus or eSFR ISO
Introduction - Test chart - Photograph - Lighting - Run SFRplus - Rescharts SFRplus - SFRplus settings - Auto run options - Display options - Secondary readout - Interpret the results - Batches - Checklist - Links

eSFRiso_enhanced_200WeSFR ISO – Automated analysis of the ISO 12233:2014 Edge SFR chart

Using eSFR ISO Part 1 - The ISO 12233:2014 E-SFR chart: features and how to photograph it
Slanted-edge test - ISO 12233:2014 compliance - Advantages - Obtain chart - Framing - Lighting - Distance - Exposure - Tips - Links
Using eSFR ISO Part 2 - Running eSFR ISO
Selecting files – Setup window – ROI selection & analysis area - Edge ID Files - Speeding up runs - More settings window – Secondary Readout  – Settings area – Gamma – Chart contrast ratio – Auto mode window – Warnings - Clipping – Summary
Slanted-edge results Part 3 - eSFR ISO edge results
Multi-ROI summary – Edge and MTF – Chromatic Aberration – Acutance/SQF – Histograms & noise – Image, Geometry, Distortion, FoV – 3D Plots – Lens style MTF plot – Edge roughness – Point Spread Function – Summary – CSV & JSON output
Slanted-edge results Part 4 - eSFR ISO other results (tones, color, wedge, etc.)
Tonal response and gamma - Image, Geometry, Distortion, FoV - Radial distortion - Summary and EXIF data - Color analysis - Detailed noise plot - Wedge aliasing & MTF - Multi-wedge plot - Summary - Links
 

SFRreg – Automated analysis of registration mark patterns

Optikos_Meridian_200W
Test at infinity focus with Long Range projection systems

Test imaging systems with ultrawide fisheye lenses (>180 degrees)

Test at very long camera-to-chart distances

Test at variable distances for Depth of Field.

Using SFRreg Part 1 - Registration mark patterns and how to photograph them
target projection - Chart arrays for fisheye lenses - Center Chart - Obtain and photograph chart -  Lighting - Distance - Exposure - Tips - Links
Using SFRreg Part 2 - Running SFRreg
Selecting files – Setup window – ROI selection & analysis area - Speeding up runs - More settings window – Secondary Readout – Settings area – Gamma – Chart contrast ratio – Auto mode window – Warnings - Clipping – Summary
Slanted-edge results Part 3  - SFRreg edge results
Slanted-edge results Part 4 - SFRreg other results (tones, color, distortion, etc.)
 

Checkerboard – Automated analysis of checkerboard patterns

checkerboard_ideal_framing-200WUsing Checkerboard Part 1 - Checkerboard patterns and how to photograph them
Obtain and photograph chart -  Lighting - Distance - Exposure - Tips - Links
Using Checkerboard Part 2 - Running Checkerboard
Selecting files – Setup window – ROI selection & analysis area - Edge ID Files - Speeding up runs - More settings window – Secondary Readout  – Settings area – Gamma – Chart contrast ratio – Auto mode window – Warnings - Clipping – Summary
Slanted-edge results Part 3 - Checkerboard edge results
Slanted-edge results Part 4 - Checkerboard other results (distortion, etc.)

Other (sharpness analyses – Log F-Contrast, Star, Random, Wedge
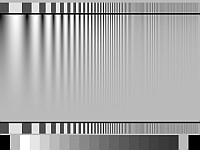
Using Rescharts - Analysis of resolution-related charts
Introduction - Getting started - The Rescharts window - resolution analyses - Slanted-edge SFR - SFRplus - Log frequency (simple) - Log frequency-contrast - Star - Wedge - Random/Dead Leaves - Focus Score
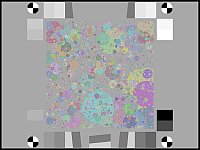
Log Frequency - Analysis of log frequency-varying charts
Introduction - Photographing, running - Color moire - Output - Pattern - MTF - Comparisons - Calculation details - Nyquist, aliasing
Log F-Contrast - Analysis of charts that vary in log frequency and contrast
Introduction - Creating, printing - Photographing, running - Output - Pattern - MTF - MTF/contrast contours - MTFnn
Sharpness and Texture Analysis using Log F‑Contrast from Imaging-Resource – comparing of several different cameras.
Star Chart - Analysis of the Siemens star chart
Introduction - Creating, photographing, running - Output - MTF - MTFnn, MTFnnP - MTF contours - Equations
Random/Dead Leaves - Scale-invariant test charts (including Imatest Spilled Coins)
           for measuring texture sharpness
Introduction - Obtaining - Photographing - running - Automatic ROI detection - Output - MTF - MTFnn, MTFnnP - Power Spectral Density - Equations & Scale-invariance
Texture examples - More details of Imatest Spilled Coins texture sharpness measurements
Images used in Random/Dead Leaves - Spilled Coins vs. Slanted edge MTF
Dead Leaves measurement issue - Illustrates challenges posed by extreme signal processing
Random/Dead Leaves cross method  - Also called the Spilled Coins cross-correlation method.
Wedge Analysis - Analysis of logarithmic, hyperbolic, or trapezoidal wedge patterns with the Wedge and eSFR ISO modules
Introduction - Recommendations - Instructions - Results - Stability - Limitations & Comparisons - Calculation details - MTF/Nyquist & Aliasing - Logarithmic wedges 
Logarithmic wedges - A superior design with the same frequency distribution as Bode of standard frequency response plots.

Sharpness utilities & postprocessors

FocusField - Use batch results from a range of distances (or apertures) to measure Curvature of Field,
          Longitudinal (Axial) Chromatic Aberration, Depth of Field, and lens focal length.
Introduction – Examples – Prepare the test – Range and Increment – Acquire the images – Analyze – Run FocusField - FocusField Settings – Results – Curvature of Field – Depth of Field (DoF) – Longitudinal (Axial) CA – Lens focal length – Stereo (3D) compatibility 
Image Stabilization/Sharpness Compare - SFRplus postprocessor for analyzing (Optical) Image Stabilization
          and comparing sharpness of different images
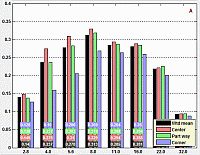
Introduction - Operation - Metrics - Results
Batchview - Postprocessor for viewing summaries of SFR, SFRplus, eSFR ISO, or Checkerboard results
Introduction - Preparation - Instructions
Find Sharpest Files - Find the sharpest files in a batch
Introduction - Operation - Details - Example - Plot 
MTF Compare - Compare MTFs of different cameras and lenses (now used infrequently)
Introduction - Instructions 

Tone, color, and spatial modules

Tone, Color, Noise, and Dynamic Range
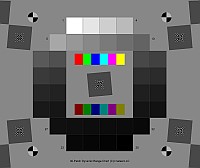
New Imatest Dynamic Range film chart with Dmax = base+3.4Using Color/Tone Interactive – Interactive analysis of color & grayscale test charts
Introduction - Getting started - Supported charts - Reference files - The Color/Tone Setup window - Displays and options
Using Color/Tone Auto (Multitest) - Fixed (batch-capable) analysis of color & grayscale test charts
Introduction - Getting started - Reference files - Results
Color/Tone/eSFR ISO Noise - including chroma, sensor (raw), and visual noise
Chroma noise - Imatest Dynamic range - Image sensor (raw) noise and Dynamic Range - Temporal noise – ISO 15739 & CPIQ Visual Noise – ISO 15739 SNR and Dynamic Range – f-stop noise & scene-referenced SNR 
Image Sensor Noise – measurement and modeling - using raw files for image sensor Dynamic Range and Simatest camera/ISP simulator
Experimental technique - Raw files – Black level offset - Noise model – Dynamic Range – EMVA 1288 – Closing the loop
Color/Tone Test Chart Reference & Guide - A guide to the color & monochrome charts used by Color/Tone.
Chart list – Layout – Numbering – Media/materials – Reference values and files - Color charts - ColorGray-42 - DR36+Color - Monochrome (B&W) charts  
Color/Tone Special Charts (OBSOLETE) - Additional charts, including ISO OECF and noise chats and circles arranged on a square  Instructions - Patch numbering - Examples
Color Correction Matrix (CCM) Calculate a matrix (usually 3x3) for correcting image colors (often from raw images)
Introduction - Math - Calculating in Color/Tone Setup - Saturation - Applying the matrix  1. in Color/Tone  2. in Image Processing  3. externally with program code
Contrast Detection Probability (CDP)  - Based on IEEE p2020 automotive image quality standard
Nonuniformity Correction in grayscale and color chart modules for Color/Tone Auto or Setup, Stepchart, and Colorcheck
Dynamic Range - a general introduction with links to Imatest modules that calculate it.
Contrast Resolution - A special transmissive chart for measuring the visibility of low contrast features in larger fields over a wide dynamic range. Analyzed with Color/Tone Interactive or Auto.
Gamutvision - A module for exploring ICC profiles and gamut mapping — illustrates how colors change when images are moved between files and devices.
Using Gamutvision instructions - Using Gamutvision Part 2: Displays - Gamutvision Table of Contents/Site Map 
Black point compensation demystified - Round trips for evaluating printer profile quality 
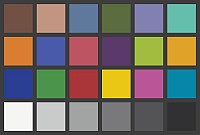
Using Colorcheck (legacy module; not recommended – use Color/Tone instead)
What Colorcheck does - Colorchecker colors - Photographing target - Running Colorcheck - Colorchecker reference sources - Output - Temporal noise - Auto White Balance (AWB) - Saving - Links
Colorcheck/Color/Tone Appendix - Color difference algorithms and reference formulas
Color difference formulas - Color ellipses (Delta-C ab, Delta-C 94, Delta-C 2000, etc.) - Color difference visualizer - Chroma correction (corr) - Algorithm - Grayscale and Exposure error (fix in 5.1+)
Using Stepchart (legacy module; not recommended– use Color/Tone instead)
Photographing the chart - Running Stepchart - Output - Temporal noise - Auto Exposure (AE) - Saving - Dynamic range - Algorithm
Stepchart: Special and ISO charts  Photographing chart - Instructions - Patch order
Dynamic Range (postprocessor) - Calculate Dynamic Range from several Color/Tone Auto or Stepchart images
Introduction - Operation - Results - Dynamic Range background (f-stop/scene-referenced noise)
Measuring test chart patches - with a Spectrophotometer and one of two software packages
Spectrophotometer- Babelcolor Patch Tool - SpectraShop 4 - Patch order

Spatial and Uniformity (Flat field) modules
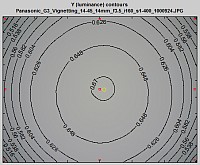
Light Falloff contour plotUsing Flatfield, Part 1 - Measure lens vignetting and image nonuniformity
Instructions - Results
Using Flatfield, Part 2 - Features in Imatest Master and IS (not in Studio)
Input dialog box - Hot and dead pixels - Color shading - Flatfield profiles - Grid plot - Polynomial fit -  Histograms - Noise detail - Spot detection
Using Flatfield-Interactive - Interactive measurement of vignetting and sensor nonuniformity (can be used with direct image acquisition)
Instructions - Results
Using Flatfield Blemish Detect - Measure visible sensor defects
The Human Visual System - Algorithm - Instructions - Input dialog - Results
Flatfield INI Reference
Flatfield statistics - Measure PRNU & DSNU with methods based on EMVA-1288: Separate fixed-pattern (spatial) noise from temporal noise by processing multiple identical images.
Lightbox Comparison Guide - Comparing lightbox brightness and uniformity
Testing flat screen displays - with Imatest Blemish Detect
Testing method - Defective pixels - Luminance nonuniformity - Color nonuniformity - Summary
Dot Pattern - Analysis of a grid of circular dots
Introduction - Setup - Results

Miscellaneous modules and utilities

Lighting Control - Set up and control DMX lights (Kino Flo) and Lightboxes; monitor lighting conditions with an Imatest Spectral Sensor.
Arbitrary Charts - Analyze a chart layout you have designed yourself. 
Introduction - Analyses & Output - INI settings - Chart Definition Files - Chart Definition Utility
Device Manager - Connect to cameras, adjust settings and acquire images into interactive modules.
Video: Dynamic measurements - These can also be performed with direct image acquisition.
Auto White Balance (AWB) - Auto Exposure (AE) - Auto Focus (AF)
Test Charts - Create test charts for high quality inkjet printers
Introduction - Bitmap patterns - SVG patterns - Options
SVG Test Charts - Scalable Vector Graphics charts for MTF and other measurements
Introduction: m x n squares - Squares and wedges - USAF 1951 chart - Operation - Options - Output figure - Printing
Using Screen Patterns - Monitor patterns for Light Falloff, SFR, Distortion, and monitor calibration
Introduction - Light Falloff - SFR - Distortion - Monitor calibration - Monitor gamma - Zone plate - SMPTE color bars - Slanted edges - Colorchecker-Stepchart - Squares (checkerboard)
Rename Files - using EXIF data
Starting - 1. Select folder - 2. Select files - 3. Rename options - 4. Preview - 5. Rename files
Image Processing - Simulate several image processing operations (degradations: blur and noise; enhancements: sharpen, bilateral filter, tone mapping, etc.) and observe their effects on appearance and measurements (MTF, SSIM, etc.).
Operation - Image processing blocks - Displays and analysis - Optical Character Recognition (OCR) - Face and People Detection
Image Statistics - Interactively observe image statistics: cross sections, means, noise, SNR, histograms, and frequency spectra.
Database - Collect and store important information on image capture conditions, device state, and EXIF metadata
Composite Chart - Create a synthetic test chart from several individual image files. Can be used for Photon Transfer Curves.
Educational Apps - Learning resource for image quality factors and measurements. 

Imatest IT – Industrial Testing (non-GUI)

Managing Supply Chain Image Quality with Imatest
Imatest IT Test Items & Modules
Imatest IT-EXE instructions - Running Imatest IT (Industrial Testing)-EXE
Introduction - Installation - Step 1: Capture Images - Step 2: Configure INI File - Step 3: Call Imatest IT Modules - Step 4: Process Results - Error Handling - Sample Code - Advanced Topics - Troubleshooting
Imatest IT-C instructions - Running Imatest IT (Industrial Testing)-C
Introduction - Installation - Step 1: Capture Images - Step 2: Configure INI File - Step 3: Call Imatest IT Modules - Step 4: Process Results - Error Handling - Sample Code - Advanced Topics - Troubleshooting
Imatest IT-C++ instructions - Running Imatest IT (Industrial Testing)-C++
Introduction - Installation - Step 1: Capture Images - Step 2: Configure INI File - Step 3: Call Imatest IT Modules - Step 4: Process Results - Error Handling - Sample Code - Advanced Topics - Troubleshooting
Imatest IT-Python instructions - Running Imatest IT (Industrial Testing)-Python
Introduction - Installation - Step 1: Capture Images - Step 2: Configure INI File - Step 3: Call Imatest IT Modules - Step 4: Process Results - Error Handling - Sample Code - Advanced Topics - Troubleshooting
Imatest IT-.NET (C#) instructions - Running Imatest IT (Industrial Testing)-.NET (C#)
Introduction - Installation - Step 1: Capture Images - Step 2: Configure INI File - Step 3: Call Imatest IT Modules - Step 4: Process Results - Error Handling - Sample Code - Advanced Topics - Troubleshooting
Imatest IT-.NET (Visual Basic) instructions - Running Imatest IT (Industrial Testing)-.NET (Visual Basic)
Introduction - Installation - Step 1: Capture Images - Step 2: Configure INI File - Step 3: Call Imatest IT Modules - Step 4: Process Results - Error Handling - Sample Code - Advanced Topics - Troubleshooting
Imatest IT Parallel (IT-P) - Accelerating Imatest IT by performing tests in parallel
Imatest INI file reference - Reference to INI files for IT/EXE and IT/DLL users (sections used in several modules)
INI file structure - INI File Monitor - [api] (for Imatest IT) - [dcraw/LibRaw] - [rdraw] (Generalized Read Raw) - Secondary Readouts - Miscellaneous
SFR INI file reference | SFRplus INI file reference | eSFR ISO INI file reference | SFRreg INI file reference | Checkerboard INI file reference
Direct Read Mode - Pass image data directly into Imatest IT, without writing to a file on disk
Implementing Pass/Fail - Setting up Pass/Fail criteria and Pass/Fail Reference. For Imatest IT and GUI versions.
Pass/Fail Monitor - Realtime display and update of pass/fail results (useful with Imatest IT)
Operator Console - User interface for production environments
Imatest IT Knowledge Base - Articles about Imatest IT

Appendix

FAQ - Frequently Asked Questions
Cross-reference tables - Tables to help you navigate Imatest
Suppliers - Image quality factors - Modules - Test charts - Test images
Version comparison: Studio vs. Master - Which is right for you?
Troubleshooting - What to do when Imatest doesn't work
Installation problems - Problems after install - Missing DLLs - Runtime problems - Corrupted INI file - Command (DOS) window - A module has stopped working - Diagnostics runs - Path conflicts
Imatest Change Log - Imatest release history
Default INI Folder - Location on your computer of resource files used by Imatest
INI file reference
License - The Imatest End User License Agreement (EULA)
Glosario en Espanol

Index of the Table of Contents
Image quality — Sharpness — Other IQ factors — IQ Utilities —  Getting started — Imatest Instructions – general — 

Troubleshooting —  Knowledge Base highlights — Slanted-Edge sharpness modules — Other sharpness modules —
Tone, Color, Noise & Dynamic Range modules — Spatial & Uniformity modules —
Miscellaneous modules and utilities
— Industrial Testing edition — Appendix