Direct image acquisition allows images to be captured directly from a variety of devices without first being stored as files. It has several important applications.
Introduction - Direct data reload for realtime analysis - Signal averaging
- By continuously reloading images, it can be used for realtime (or near-realtime) image analysis, where "realtime" means that analysis appears to be instant in the timeframe of human perception. It is especially valuable for focusing with slanted-edges (which can be analyzed faster than other MTF patterns) or with cropped areas of arbitrary images.
- It is very useful for signal averaging — a technique that combines multiple images to improve Signal-to-Noise Ratio (SNR) and remove the effects of noise from measurements. Signal averaging is a key part of spatial nonuniformity measurements such as PRNU (Photo Response Nonuniformity) and DSNU (Dark Signal Nonuniformity), which work best with 100 or more averaged images. Averaging a large number of images stored in files can be very cumbersome. It is extremely convenient with direct image acquisition.
Although it has been a feature of Imatest since at least version 3.6, the popularity of this feature shot up with the release of Imatest 2020.2. Direct Data Acquisition now allows realtime focusing (at refresh rates greater than 10 reloads/second, depending on image size and interface). This was a game-changer for applications that require realtime analysis.
| With the release of Version 2021.1, Imatest Master now offers Edge Tracking during live focusing. This enables refinement of your regions of interest as focus or distance adjustments impact your camera's magnification and cause your regions of interest to shift. When displaying more than one region, shifts of the position of the target within the image can be tracked. |
 ▶
▶Related pages
|
The Imatest Image Acquisition Device Manager – Using direct image acquisition Supported image acquisition hardware – How to get support for your image acquisition hardware |
Introduction
Although the majority of images traditionally analyzed by Imatest have been from files (JPG, PNG, etc.), three modules, which can perform a majority of Imatest’s analyses, support direct image acquisition.
- Rescharts, which analyzes a variety of sharpness/MTF charts: slanted-edge charts with automatic or manual detection, Siemens Star, Log Frequency Contrast, Spilled Coins (Dead Leaves), or any arbitrary image (which produces uncalibrated relative sharpness measurements). Depending on the chart, measurements may include lateral chromatic aberration, optical distortion, and tonal response (OECF). Noise, SNR (Signal-to-Noise Ratio), and color response are available with eSFR ISO.
- Color/Tone Interactive, which analyzes all widely-used color and grayscale charts (as well as a good many custom or obscure charts). Measurements include tonal response, color accuracy, noise, and SNR,
- Uniformity Interactive, which analyzes flat field images for vignetting (light falloff), color nonuniformity, noise, SNR, and PRNU (photo response nonuniformity) and DSNU (dark signal nonuniformity).
Direct data reload for realtime analysis
When Auto reload is selected, direct data acquisition works as shown in the illustration below. 1. Acquire the image. 2. Analyze. 3 Display. Then repeat until Stop reload is pressed.
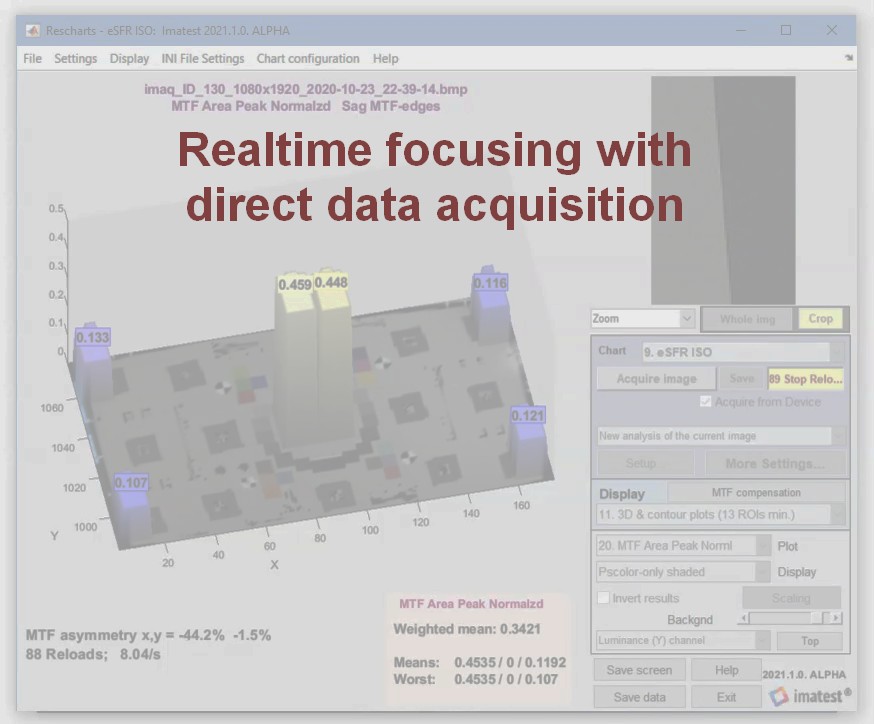
The following video, made using an inexpensive 2MP USB camera selected with the Device Manager and run in Rescharts, illustrates real-time focusing using slanted edges from an eSFR ISO test chart.
 ▶
▶Improvements made after this video was produced have increased reload speed by about 50%.
To directly acquire images that can be updated in realtime,
- Run Device Manager to select the device to analyze, the device resolution, and to frame the image using the Preview function. The Device Manager can also be run from any of the modules that support direct acquisition. Note that acquisition only works when the system has sufficient available memory (about 2 GB). In Windows this can be viewed in the Performance tab of the Task Manager.
- Open one of the three modules that support image acquisition: Rescharts, Color/Tone Interactive, or Uniformity Interactive. Note that SFRplus Setup, eSFR ISO setup, SFRreg Setup, and Checkerboard Setup are all run from Rescharts.
|
Saving directly-acquired imagesTo save an image directly acquired from a device, click the File dropdown menu, then select Save image to file. This opens a standard dialog box that lets you select the file name and location (which defaults to subfolder Results of the last accessed image file folder). You'll probably want to select your own preferred names and locations. | 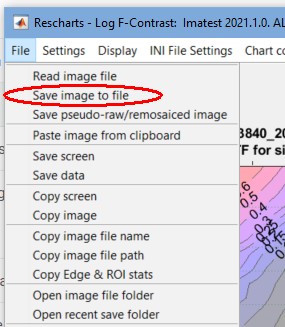 |
The following image shows the Edge/MTF display with Settings that affect direct acquisition.
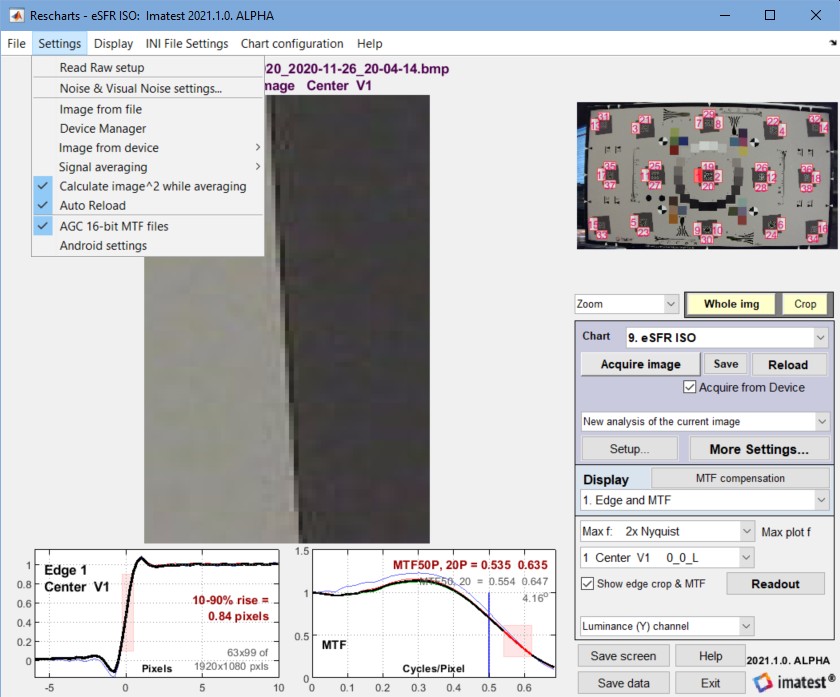 Edge/MTF display with Show edge crop & MTF checked.
| Image from file (checkbox) | Read image from file. Turn off direct image acquisition. |
| Device Manager | Open the Device Manager. Lets you select device for acquiring the image and properties of the device: resolution, exposure, etc. |
| Image from device > | Lets you select device. May not be up-to-date. Not recommended. Use Device manager instead. |
| Signal averaging > | Signal averaging. Can be turned off (None) or set to 2, 4, 8, 10, 16, 32, 64, or 128 averages (image reads). Useful for reducing or removing noise, which can improve the accuracy of many calculations, especially Log Frequency Contrast and Random/Spilled Coins. Required for Uniformity Statistics calculations performed with Uniformity Interactive (Photo Response Nonuniformity (PRNU) & related calculations based on EMVA 1288). Not recommended when Auto reload is checked. |
| Calculate image^2 while averaging (checkbox) | When checked, the variance of the image is calculated during signal averaging. Used in PRNU calculations and for noise imaging, to be presented at the Electronic Imaging 2021 conference. |
| Auto reload (checkbox) | Check for Auto reload— for realtime data analysis. If unchecked, only a single image is reloaded when the Reload button is pressed. |
While all measurements in Imatest 2020.2 have been sped up by a factor of 4 to 10 or more compared with 2020.1, focusing is the most important and most speed critical function. If it’s done at all, it needs to be fast.
Focusing works best with the following displays.
- Edge/MTF, which displays a single slanted-edge, and can be displayed from slanted edge modules: Slanted-edge SFR, SFRplus Setup, eSFR ISO setup, SFRreg Setup, and Checkerboard Setup, all of which are run from Rescharts. Two variants are available.
- With Show edge crop & MTF checked (shown above) a large image of the edge is displayed along with small edge and MTF plots below the edge image. Reloads are very fast (>15 reloads/second can be achieved with 2 MP images).
- With Show edge crop & MTF unchecked (shown below, after multiple acquisitions). An MTF50 history plot is displayed on the top.
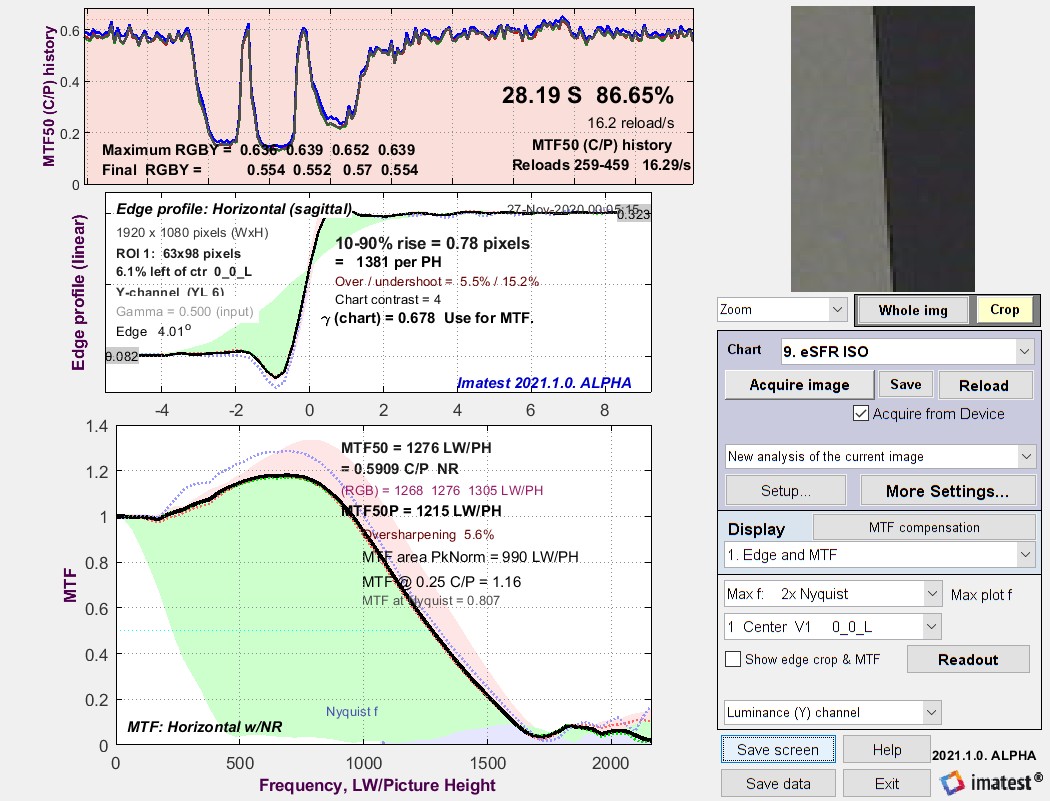 Edge/MTF display with Show edge crop & MTF unchecked. A plot of MTF history is shown.
- 3D & contour plot. Available in automatically-detected slanted-edge modules. Lets you analyze multiple regions. A maximum of 10 are recommend (center regions, corners, top, bottom, left, right). The 6 regions shown here reload extremely fast.
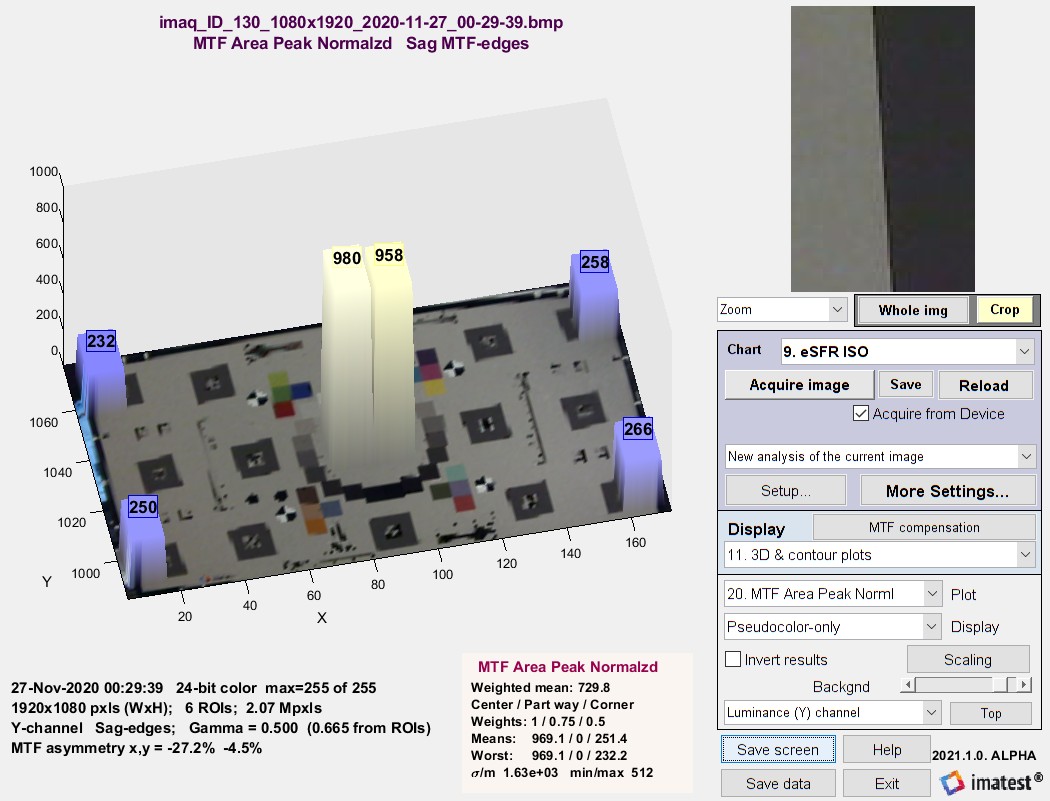 3D plot. Pseudocolor-only (shaded slows down the reloads)
Focus Score Plus
Available in 2021.1, upgraded from Focus Score in earlier versions. Focus Score Plus calculates more than sharpness, and can be used for Auto White Balance/Auto Exposure/Autofocus (AWB/AE/AF) calculations. Focus score can calculate focus for any object with well-defined edges. It is extremely fast (though only about 20% faster than single slanted-edge calculations). It is excellent for rapid focusing, but numerical results are not standard and cannot be used to compare different images, imaging systems, etc.
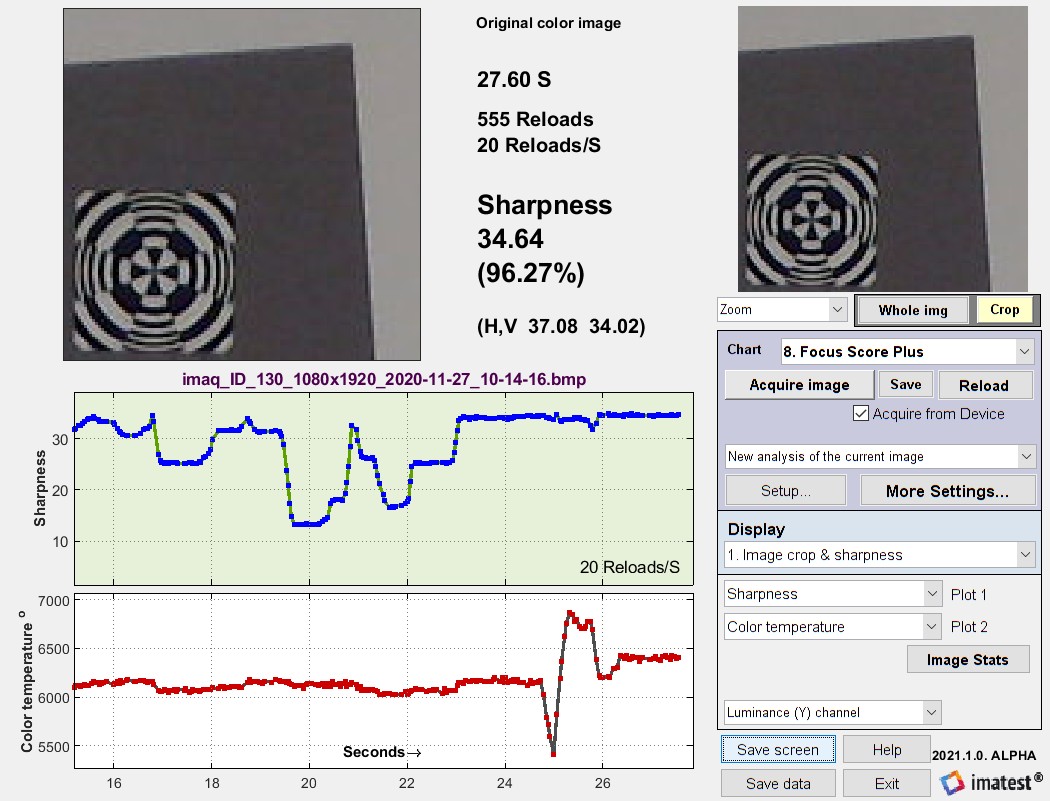 Focus Score Plus results, showing history plots for Sharpness and Color temperature
Focus Score (pre-Imatest 2021.1) displayed a history plot of sharpness-only. Focus Score Plus (Imatest 2021.1+) displays one or two history plots.
- Plot 1 can display Sharpness, Pixel levels normalized, Pixel levels original, Color temperature, or CIELAB c (√(a*2 + b*2) ).
- Plot 2 can display Pixel levels normalized, Pixel levels original, Color temperature, or CIELAB c (√(a*2 + b*2) ), or the time increment (mostly of interest to developers).
Other test patterns are slower than slanted-edges, but the Siemens Star and Wedge are still usable for focusing.
- The Siemens Star is a good pattern for focusing, but relatively slow. We hope to speed it up when 2021.1 is released.
- Wedge calculations are significantly improved in 2021.1. They are slower than slanted-edges, but still fast enough for focusing, and they can exhibit interesting out-of-focus behavior.
- Random/Spilled Coins and Log Frequency-Contrast are primarily used for analyzing image processing. They are not designed for focusing. Because they are strongly affected by noise, they work best with signal averaging.
Signal (image) averaging
Signal averaging is a technique that combines multiple images to improve Signal-to-Noise Ratio (SNR) and reduce or remove the effects of noise from measurements. It is a key component of spatial nonuniformity calculations — PRNU (Photo Response Nonuniformity) and DSNU (Dark Signal Nonuniformity), which work best with 100 or more combined images. Averaging a large number of images stored in files can be very cumbersome. It is extremely fast and convenient with direct image acquisition.
| Signal averaging works with multiple image files as well as direct data acquisition. |
Signal averaging improves SNR by 3 dB (decibels) for each doubling of the number of images, i.e., 3 dB for n = two images; 6 dB for n = four images, ..., 21 dB for n = 128 images (the maximum currently allowed for direct acquisition). The equation is SNR improvement in dB for n images = 3 log2(n) = 10 log10(n).
Signal averaging is especially valuable with modules designed to analyze image processing: Random/Spilled Coins and Log Frequency-Contrast, both of which analyze system behavior at low contrast levels where noise is difficult to distinguish from the image signal.
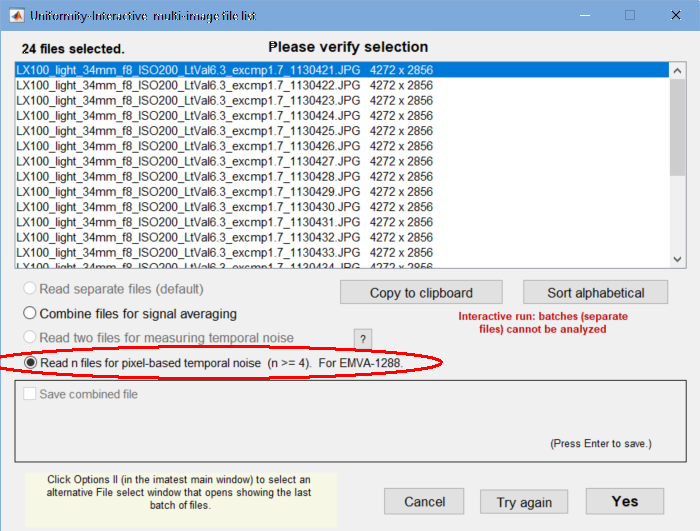
To average signals from a batch of files, read the batch using the usual techniques, then check the appropriate box in the multi-image file list window, shown on the right for Uniformity Statistics (PRNU and DSNU) calculations.
To average signals using direct image acquisition, set Signal averaging > to the desired value (often 128 reads), and set Calculate image^2 while averaging as required (checked for PRNU and DSNU). Then acquire the averaged image.
We had hoped to show before/after images, but the cameras we are using for direct image acquisition have large amounts of software noise reduction built-in, so there wasn't much difference. Here is a result from Log Frequency Contrast result for 128 averages. We plan to improve the annotation, since the averaging operation is less obvious than it should be — indicators are circled in red.
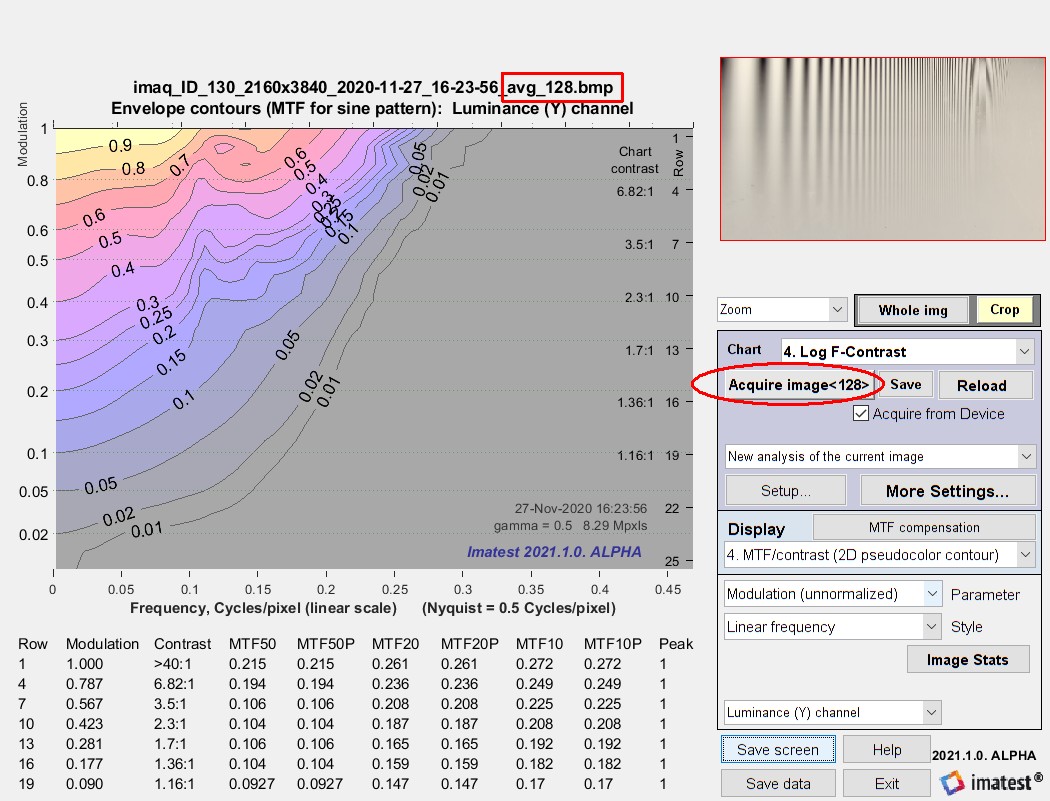 Log F-Contrast results for 128 averages from our USB camera
|
A comparison of the above results with results presented in Sharpness and Texture Analysis using Log F‑Contrast from Imaging-Resource illustrates the extreme noise reduction in our inexpensive USB camera. MTF drops to 0.5 at contrast level 0.5, versus 0.05 for the Panasonic DMC G3 camera shown in the link and on the right. This means that our camera has virtually no noise (along with no low contrast texture); hence the averaged signal was nearly identical to a single sample. Log F-Contrast results for | 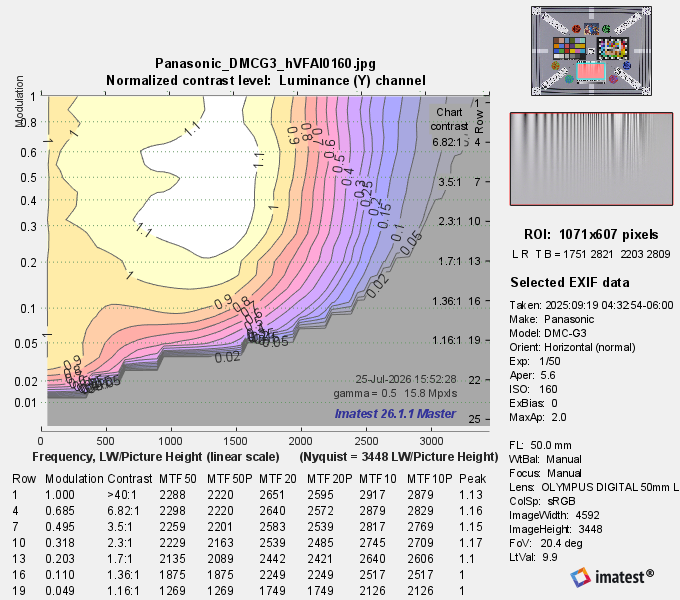 |