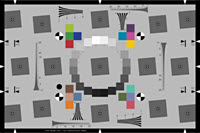
The two most popular charts types/analysis modules are SFRplus and eSFR ISO, These allow users to measure a great many image quality factors from single test chart images. Other modules and charts let you meet a wide variety of testing challenges.
Links to Content on this page:
The Imatest workflow
Basic Imatest workflow
1.
Determine the image quality factors (sharpness, color response, tonal response, noise, optical distortion, etc.) that need to be tested.
Photograph the charts, framing them according to the instructions for the intended analysis modules. If you're starting out, sample images for several modules can be downloaded from Github.
4.
Open Imatest and analyze the image using the appropriate module.
5.
Interpret the results based on experience and by comparison with comparable cameras.
6.
Save the results, which consist of figures and text (in CSV or JSON format), as needed.
Download & trial version — You can download Imatesthere. Installation instructions are here. If you are a new user, a 14-day free trial will automatically beginwhen you run the software for the first time. When you are ready, you can purchase an Imatestlicense from the store and activate it as indicated in these links.
License Activation note: An Imatest Node-locked license can be activated on only one computer at a time, but the activation can be moved between computers. You can install Imatest –and keep it installed– on as many computers as you like (Macintosh as well as Windows). To move the activation to another computer, you'll need to deactivate it on the old computer then activate it on the new one, following the instructions above. An Imatest Floating license can be more easily shared among multiple computers as the deactivation and reactivation steps are not required. Read more about the different license types here.
Imatest Studio, which has everything an individual photographer needs to test cameras and lenses (but lacks many of the advanced features for designing and manufacturing cameras), is available to individual photographers and small studios.
Imatest IT (Industrial Testing), is a non-GUI version of the Imatest software, designed for manufacturing environments. The IT interface will not be discussed on this page.
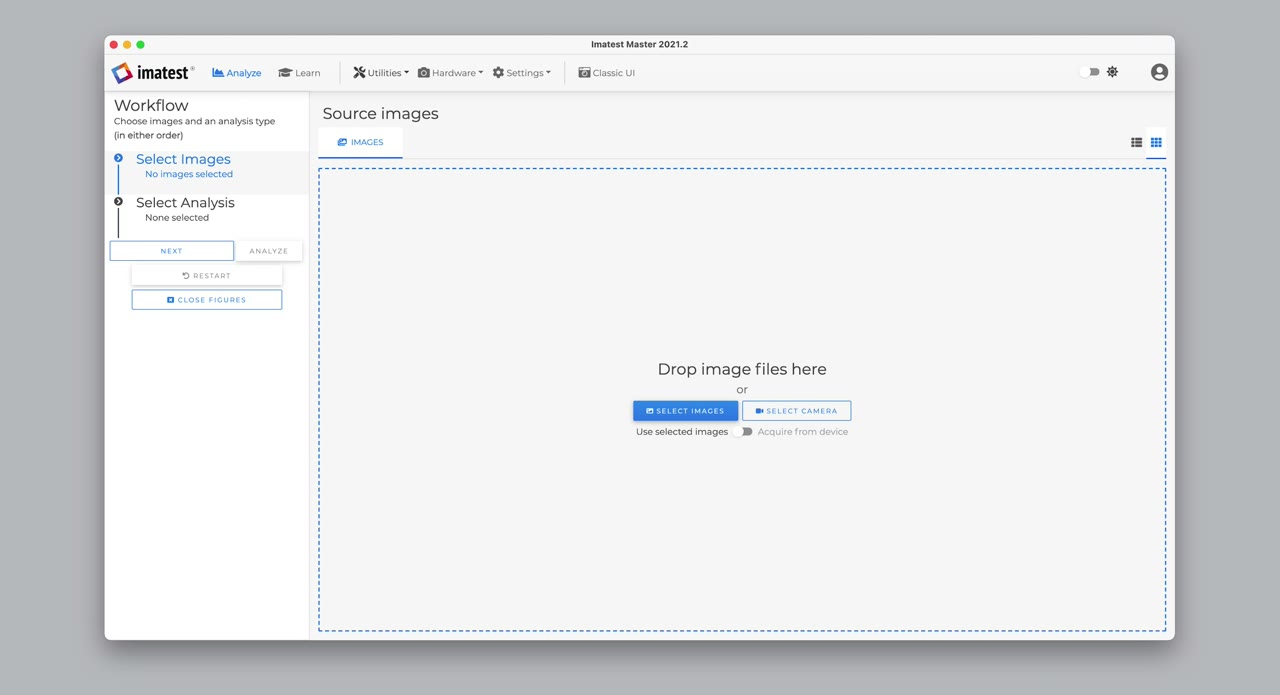
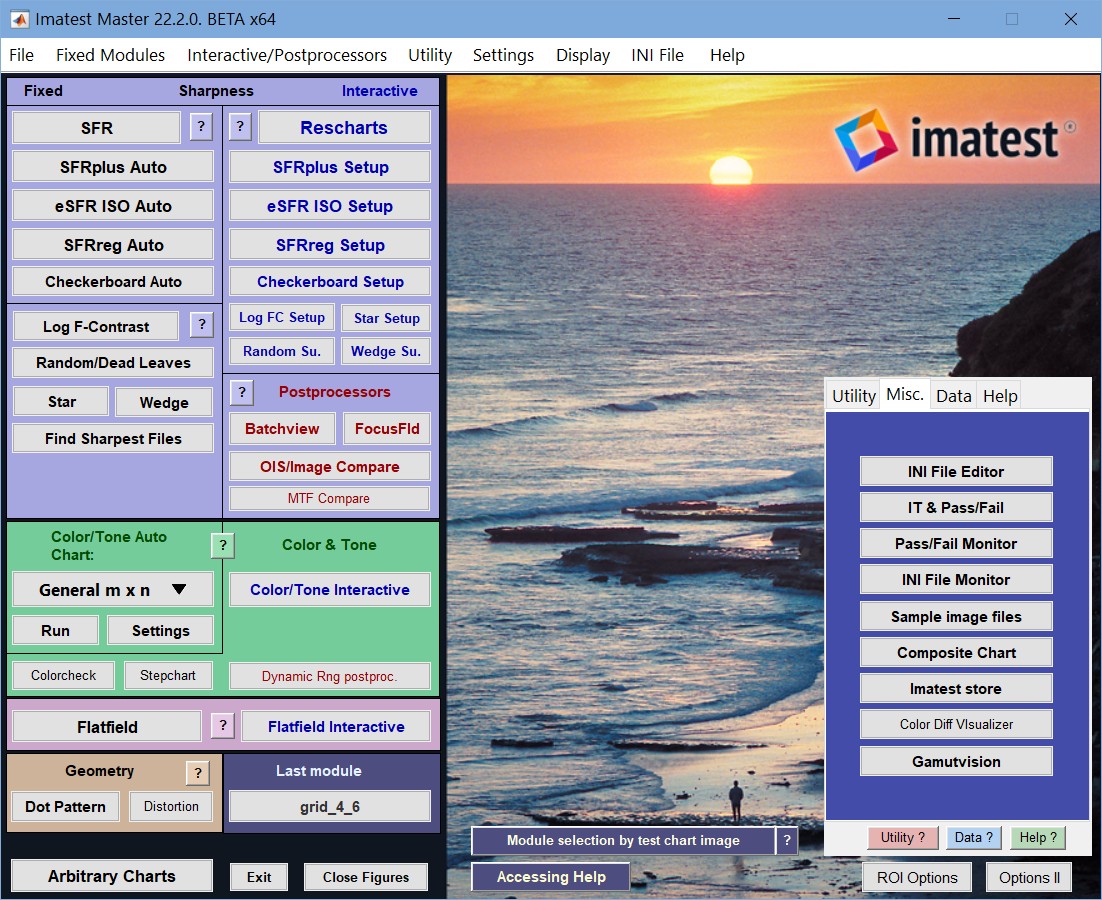
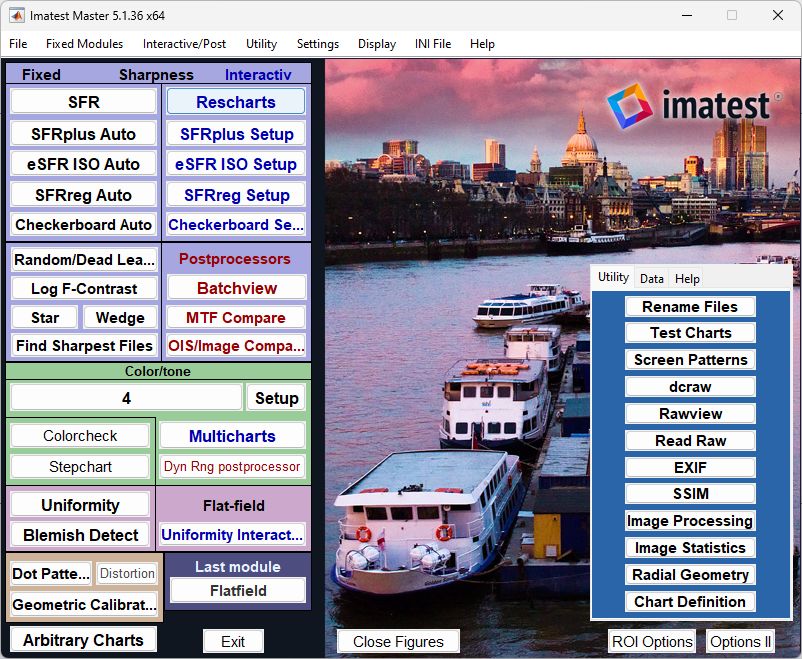
The Imatest Main Window allows the user to access all the features of Imatest. Our Main Window was updated in the 2021.2 Release. Read about the new Imatest Main Window here.
There is also an option to use the original Imatest interface, by choosing “Classic UI” in the Main menu – documentation on the classic Main Window is here.
Classic Imatest main wndow. Click on image to view full-sized.
Interactive vs. Auto(Batch)
Most Imatestanalyses can be performed in either interactiveor Auto (Batch) mode.
In Version 2021.2, Imatest introduced a New Main Window - making it easier to select images and analysis.
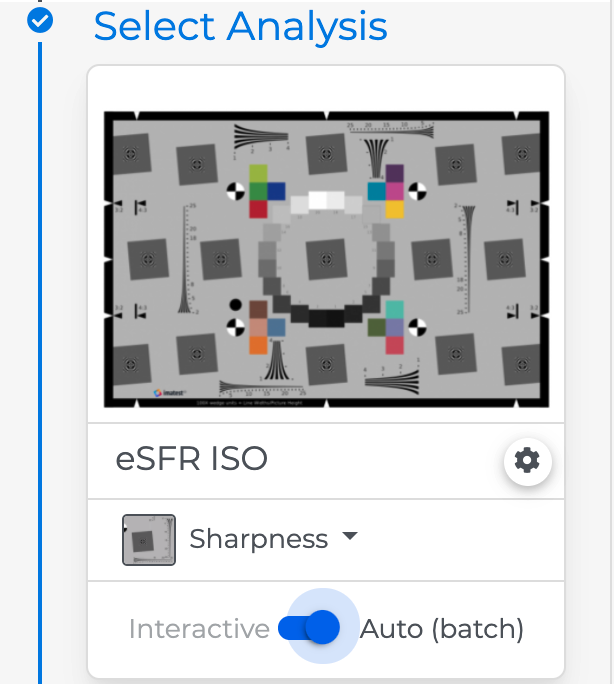
On the new Imatest Main Window (2021.2), choose the desired mode by setting the Interactive/Auto(Batch) switch option near the bottom of the Analysis card.
Interactive vs. Auto(Batch) Analysis options (These should not be confused with automatic vs. manual region selection, described below in ROI Options.)
Interactive mode
Use this mode to read and analyze images from files, or directly from acquisition devices and to interactively explore settings and results.
Auto (Batch) mode
Use this mode to efficiently run analyses on individual files or batches of files, using settings that have been previously configured (prior to the auto/batch run).
In the new Imatest GUI, choose the analysis (such as eSFR ISO) and set mode on Analysis card to Interactive.
In the new Imatest GUI, choose the analysis (such as eSFR ISO) and set mode to Auto (Batch)
If using the Classic Imatest UI window, this option is chosen by clicking on the Analysis in the Right column (Interactive).
Can analyze batches of images by selecting multiple image files
Signal averaging is fast and convenient
Supports signal averaging of multiple image files
Selecting the chart and module: What do you want to measure?
This guide is intended to help beginners select charts are most likely to meet their needs. Image Quality Factors and Sharpnesscontain extensive detail about the key measurements.
Skip this table if you've already selected your chart(s).
Guide to measurements, charts, and modules, indexed by measurement Interactive modules are shown highlighted in the Classic Interface column.
Measurement
Chart
New Main
Window
Classic Interface
Sharpness (from any slanted-edge) Manual ROI detection. Works with any slanted edge, including the old ISO 12233:2000 chart. ROI selection can be fussy when multiple images need to be analyzed.
In Analysis Options for "Sharpness", select Appropriate Target.
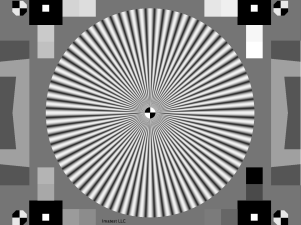
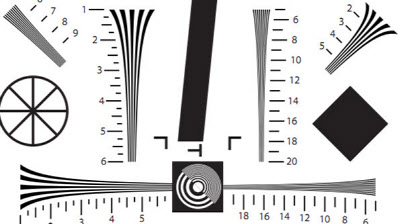
These slanted-edge charts feature automatic ROI detection, and perform multiple image quality measurements. Can be run in either interactive mode (indicated by "Setup") or fixed mode (indicated by "Auto"). They are compared here.
Each has specific strengths and applications.
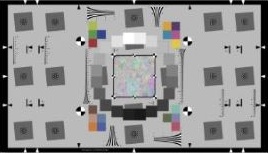
SFRplus has the greatest spatial sharpness detail and good distortion measurements.
eSFR ISO performs detailed color and noise measurements and includes wedges for measuring aliasing and moiré.
SFRreg can be used for ultra-wide angle applications. Large SFRreg charts can be printed for long-distance measurements.
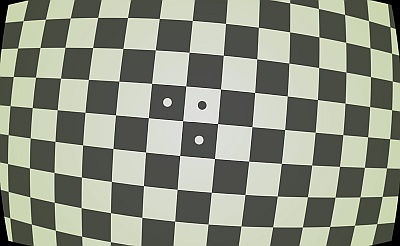
Checkerboard has the most accurate distortion measurements.
SFRplus, eSFR ISO, Checkerboard, and Dot pattern charts are designed to fill (or nearly fill) the image. Most other charts are designed to fill only a portion of the image.
Imatest charts are available in several sizes and media:
ChaChrome on glass (up to 4x4 inches (100x100mm; ultra-fine; no grayscales)),
Color photographic film (up to 8x10 inches; fine; low noise),
Black & White film (up to 12x20 inches; noisier than color; good for NIR and SWIR (Near and Shortwave Infrared)),
Photographic paper (finer than inkjet and better for NIR and SWIR), and
Inkjet (up to 44 inches high; too coarse to be suitable for very small charts). You can print your own inkjet charts, but for highest quality we recommend purchasing them from the Imatest store.
from Windows Start menu: Start → All Programs → Imatest → Version → Imatest Edition , illustrated on the right.
or from the Imatest directory, typically C:\Program Files (x86)\Imatestversion (where version is Master, IS, Studio, etc.) in win64 English language installations.
After several seconds (up to a minute after the first installation or a reboot), the Imatest main window, shown below, opens.
In the New Imatest Main Window, user can select an image, and select the analysis to be run. (This can be done in either order.) Click the "Analyze" button to run. If ROI selection, or other settings are required, a window will pop up, for user entry. (If using the Classic UI, Imatest analysis modules are run by clicking on one of the buttons in the left two columns.)
The Learn icon (top menu in the Imatest software) has links to important online documentation.
Tooltips (blocks of text that appear for a few seconds when you hover the mouse above a button) contain concise descriptions of the button function.
In the Classic UI, right-clicking on most buttons in the Imatest main window (including the tabbed box on the right) opens a help document for the button function.
If you're starting out, sample images for several modules can be downloaded from Github.
Questions? You can often find answers by searching the Documentation page or by searching the entire website using the magnifying glass icon on the upper-right of web pages. If that doesn't work,
Each of these emails go to several people. It is helpful to include one of these, even if you are trying to reach a specific person, because you are more likely to get a quick response if that person is unavailable. Here are a few more helpful resources.
Settings are saved in an INI file named imatest-v2.ini, described in detail in Saved settings (INI files)and in theManage settings button in the Data tab .
Settings include Font size, folders for opening and saving images, calculation parameters, plot selection, and figures to display and save. Several INI file utilities can be accessed from the INI File dropdown menu, described below. You can view or edit the settings withINI file editor orView settings (ini file), save or load ini files, and do much more.
The Displaydropdown menu contains important settings that affect font, windows, and figure size. You should set fonts be the right size relative to the image: not too small, which makes test difficult to read and doesn't utilized space reserved for text, and not too large, which causes text to cover other objects.
A really early version of Imatest
Imatest has several settings to adjust font and window size for the DPI scaling of different computers.
To access these, click Display (on the top bar of the main window), which opens the dropdown shown on the left. Settings:
Font size: set it so it appears correct in figures, i.e., not too small or large.
Normal or enlarged screen (Imatest main window).
Normal or enlarged figures (1.25 or 1.5x). You may need to enlarge the font for enlarged figures.
Normal or enlarged interactive windows (Color/Tone Interactive, Rescharts, Batchview, etc.)
Open the image file
Most Imatest analysis modules require an image file to be opened.
When you open the module (in some cases) or push a button to open an image file (in other cases), a dialog box opens that requests the name of the image file. Supported image file formats are summarized below.
Commercial raw formats converted using Libraw. These include CR2, NEF, RW2, and many more. See LibRaw 0.20 supported cameras. New cameras are typically added to LibRaw within a month or two of their introduction.
Binary files identified by extensions specified in the Generalized Read Raw window. You can set the pixel size,bit depth, demosaicing parameters, offset, etc., for the extension.
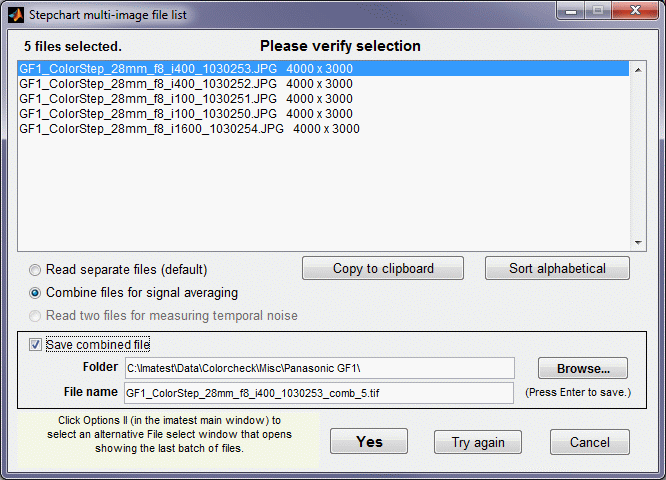
Multiple file read (batch mode) You can select several files to read. Depending on how you respond to the multi-image dialog box (below),
Files can be analyzed individually in sequence (batch mode),
Files can be combined— averaged— and the mean can be analyzed (and also be saved if needed). This can reduce noise (by a factor of √N for N files), making MTF calculations more accurate. Signal averaging is also useful for measuring sensor fixed pattern noise in Stepchart, Colorcheck, Color/Tone Interactive, Color/Tone Auto, and Uniformity,
The files should be in the same folder, have the same pixel dimensions (for most modules), and be framed identically (except for SFRplus and other modules that use automatic detection, where they can be any size). If you choose Combine files, you'll have the option of saving the combined file with 16-bit TIFF format as default. Batch mode is not supported in interactive modules such as Rescharts or Color/Tone Interactive.
For combined files, the saved file name is the same as the first selected file name with _comb_n appended, where n is the number of combined files.
Enter additional input data. Unless Express mode has been selected, a Settings window opens that settings data, depending on the module. Most additional data is optional (and is saved from previous runs); you only need to pay attention to settings you wish to change. Click OK to run the program or Cancel to terminate the run.
Save results? After an analysis has been run, a dialog box asks if you would like to save the results. Checkboxes in the dialog box enable you to select the Figures, CSV (Excel-readable), and JSON files to be saved. You can examine the results before deciding which, if any, to save. (The Save box is omitted in the evaluation version.) Figures can be saved as PNG (losslessly-compressed) image files or Matlab Fig files (not recommended because of their large size. Fig files can be opened and manipulated with Open Fig file.
Helpful buttons
In the New Main window, click on the "Learn" Tab - to learn about Imatest Image Analysis, Charts, IQFs and Standards. It also has links to the Educational Apps. Or, click on Help menu on the top menu bar.
Buttons below are used to access help in the Classic UI.
Each of these buttons, which are in the tabs on the right of the image, opens a large Help window with lots of explanations and buttons that open a variety of functions. You should familiarize yourself with them and use them whenever the need arises.
Manage settings (in the Data tab) opens a window that explains some of the key functions for setting and examining the contents of the file for saving Imatestsettings, imatest-v2.ini. It also displays the full path name to imatest.ini and shows how to fix bugs that can arise when imatest-v2.ini is corrupted. Function buttons include Save settings..., Load settings..., View/Edit settings (ini file), Copy settings (ini file), Import / Merge settings, Edit / Reset Modules, and Reset Defaults (all).
Error handling (in the Data tab) opens a window that shows what to do if you encounter an error. It includes link to the Change Log and Troubleshooting pages, buttons for Copying the current or last session to the clipboard for pasting into emails, and instructions on fixing imatest.ini when it gets corrupted.
Raw files
Raw files are the unprocessed output of digital image sensors. For Bayer sensors, each raw pixel represents a single color in RGRGRG, GBGBGB, ... sequence. To be converted into usable, standard file formats (TIFF, JPEG, etc.), raw files must be processed by a raw converter. Raw converters perform several functions: demosaicing (converting the Bayer sequence into full color), applying a gamma curve, often with an additional tonal response curve, color correction and white balance, reducing noise, and sharpening the image. These operations affect Imatest measurements, especially sharpness (MTF or SFR).
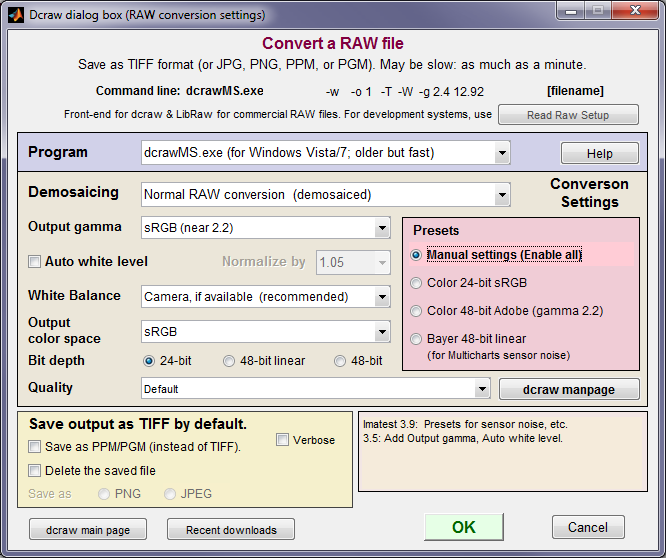
The best way to be sure an image file faithfully resembles the raw file— that it has minimal processing— is to read a raw file into Imatest and convert it into a standard format (typically TIFF) using LibRaw for commercial raw files (identified by extension: CR2, NEF, etc.) or Generalized Read Rawfor binary development files (also identified by extension, often RAW). For commercial raw files, the dialog box on the right appears. It allows you to choose among several raw conversion options. Details for both commercial and binary files can be found in Raw files.
Raw files can be converted with demosaicing (standard RGB format) or without demosaicing (which allows the original R, G(R), B, G(B) channels to be analyzed separately.
Exit closes all figures and terminates Imatest.
Close figures closes all figures. Important because the computer will slow down if too many are open. You can close figures individually by the usual Windows methods — clicking the X in the upper right or right-clicking on the figure icon on the Taskbar and selecting Close.
EXIF (in the Utility dropdown menu) displays EXIFmetadata for an image file. Most file formats supported when ExifTool is installed (instructions below). EXIF data can be alphabetized to facilitate locating settings, copied to the clipboard (for pasting into a text editor), and saved in a text file in the same folder as the image file.
EXIF viewer
Troubleshooting — what to do if you encounter a bug
Despite our best efforts (which are continually improving), customers sometimes encounter bugs, in part because we keep adding features (most requested by customers). Bugs can be caused by bad images, a bad sequence of operations, or errors in Imatestcode. There are several things you can do when you encounter an error. Most of them can be found in the Troubleshooting page or by pressing Error handling (in the Help tab).
Check the Online My License tool or the Download page to make sure you have the most recent version of the Imatestrelease allowed by your license. If you use the Download page you'll need to compare your support expiration date with the Change log. You can find the most recent version by clicking on Latest release or the Previous releases version (for example, 2020.1), then clicking on Download upgrade. The current version appears in the Save window, e.g., Imatest-2020.1.14-upgrade.exe. Download the current version if it's newer than the version you're running. For detailed highlights of Imatestreleases, see Imatest Updates and Features.
Try the technique in A module that formerly worked has stopped working, also described in Troubleshooting. Essentially, you open the INI file editor, select the section corresponding the the broken module (for example, [sfplus]), delete the section, then Save the results. This initializes the settings for the section (you'll have to reenter them), but often fixes bugs caused by a bad ini setting.
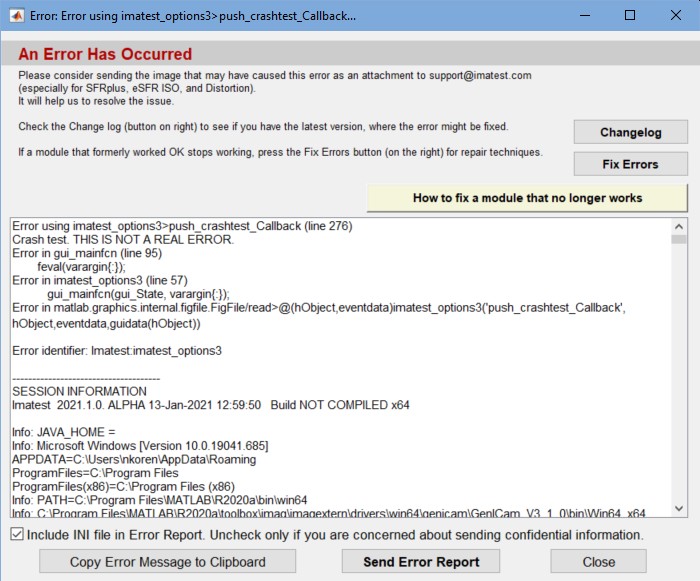
If an error reporting window (shown reduced on the right; click on it to view full-sized) appears, examine the instructions and the error text, and if it's not obvious (sometime it's an easy fix, for example, for a missing file), press Send Error Report. This opens a second window that lets you enter your email address and a description of what happened. Then press Send Error Report (yes, again). We will do our best to fix it.
It can be extremely helpful if you send the image that was loaded into Imatestwhen the error occurred. If nothing else, we'll if we find anything wrong with it.
Please follow this procedure to report an error. Sometimes we receive screen shots of this window. It's occasionally useful, but it often lacks information we need to fix the bug (the exact Imatest build, the INI file, and events that preceded the crash).
Figures
Imatest figure: You can resize it or zoom in on individual plots. The toolbar, which includes Data cursor , is shown.
Imatestresults are displayed in individual windows called Figures. A typical figure— a result of running SFR— is shown on the right.
Figures may be resized, minimized, maximized, or closed using standard Windows operations. In addition, several Windows and Matlab-specific operations can be found in the toolbar at the top of the image.
The first four icons in the toolbar are standard Windows icons: New file, Open, Save, and Print. Open and Save refer to Matlab .fig figures, which should be used sparingly because they require excessive storage.
Of the remaining icons, Zoom in: is particularly useful. Clicking on it highlights it and enables you to zoom in on regions of the plots. You can click and drag to create a zoom rectangle or you can click on any point to zoom in on that point. Double-clicking anywhere inside the image restores the full unzoomed image.
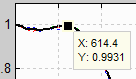
Data cursor example
Data Cursor, selected on by the toolbar icon, lets you click on a curve and display its coordinates in a small box called a Datatip. Right-clicking on the Datatip lets you can delete it or choose additional options.
In most modules, figures can be saved as either PNG files (a standard losslessly-compressed image file format) or as Matlab FIG files, which can be opened by Open Fig file in the Utility dropdown menu, then manipulated (zoomed and rotated). PNG files are usually preferred because FIG files require much more storage, especially for 3D FIG files, which can be rotated.
Too many open Figures
Figures can proliferate if you do a number of runs, especially runs with multiple regions. System performance degrades if too many Figures are open. Figures can be closed individually by clicking X on the upper right of the Figure or by any of the usual Windows techniques. You can close them all by clicking Close figures in the Imatest main window.
CSV and JSON output files
Individual Imatest modules can optionally write two types of output file that contain most results.
CSV files are most often displayed with Microsoft Excel.
JSON files, which contain a single large JSON structure, can be read into programs written in almost any language with a single line of code using functions linked from the JSON website. They can be displayed in any text editor.
Please contact us if you have requests or suggestions about Imatest output. [Notes: These files are not saved in evaluation mode. ]
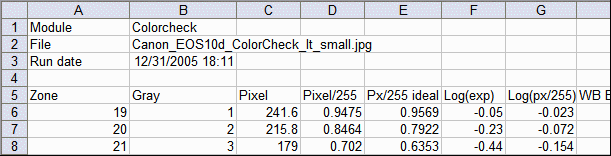
CSV files– Excel-readable Comma-Separated Variable format. Here is an example of typical output.
JSON files are somewhat human-readable text files that contain a single structure— optimized for reading into programs written in virtually any programming language.
The full text of the Imatestlicense can be found here.
License holders are encouraged to publish test results in printed publications, websites, and discussion forums, provided they include links to www.imatest.com. The use of the Imatest Logo is encouraged. However you may not use Imatest for advertising or product promotion without explicit permission from Imatest LLC. Contact us if you have questions.
Tips for successful testing
Imatest LLC assumes no legal liability for the contents of published reviews. If you plan to publish test results, especially for MTF, you should take care to use good technique. Considerations include,
If you are working outdoors, be sure the target doesn't shake in the wind.
Target distance
Be sure you're far enough from the target (the magnification is low enough) so the printed edge quality doesn't affect the measurements. Target distance considerations are given here.
Focus
Be sure the camera is focused accurately on the target. Note whether you used manual or automatic focus. Some targets, like Spilled Coins/Dead Leaves targets, may work poorly with autofocus.
Target alignment
In most cases, the chart should be normal (perpendicular) to the optical axis of the lens. Make sure the corners, as well as the center, are in focus.
Illumination
Should be as even as possible. Use an incident light meter if needed.
Exposure
Take care not to clip (saturate) shadows or highlights. This will reduce accuracy of the results.
Raw conversion and settings
The Raw converter (in or out of the camera) and image processing pipeline, particularly Sharpening, can make a huge difference. Contrast and White balance are also important. Settings that affect contrast and transfer curve can also have a strong effect. If possible a "Linear" setting (meaning a straight gamma curve with no additional tonal response adjustments) should be used.
Gamma
SFR sharpness results are moderately sensitive to the Gamma setting: A 10% gamma error changes MTF50 by 2.5%. Gamma can be measured from slanted edges of known contrast (if ≤ 10) or from a grayscale chart by running Color/Tone Interactive, Color/Tone Auto,Colorcheck or Stepchart.
Cleanliness and filters
Lens surfaces should be clean. You should note whether you have a protective (UV or Skylight) filter. It can make a difference— more likely reduced contrast than reduced sharpness. With Imatest you can find out.
File formats
Use Raw, PNG, TIFF, or the highest JPEG quality. Never use less than the maximum resolution or JPEG quality unless you are specifically testing the effects of these settings.
Lens settings
Lens performance is a strong function of the aperture (f-stop) and focal length (for zooms). Be sure to record these settings (easy because they're saved with the EXIF data) and include them in your reports. The optimum (sharpest) aperture is of particular interest. Lens performance is also somewhat affected by the distance to the target. Rename Files can add key settings to the image file name using EXIF data.
White balance
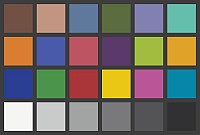
Should be close as possible to neutral, particularly in Colorcheck.
This may seem like a lot of fuss, but the technique you develop in testing cameras and lenses will spill over to your daily photography. Alfred Stieglitz tested film and developers extensively when he discovered photography as a student in Berlin. Ansel Adams performed extensive tests in the development of his zone system. Although nobody would claim that testing is responsible for their unique vision, it certainly contributed to the skill that transformed their vision into prints of transcendent beauty.
 ▶
▶
 on the Desktop,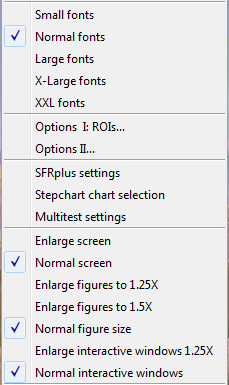
 Raw files are the unprocessed output of digital image sensors. For Bayer sensors, each raw pixel represents a single color in RGRGRG, GBGBGB, ... sequence. To be converted into usable, standard file formats (TIFF, JPEG, etc.), raw files must be processed by a raw converter. Raw converters perform several functions: demosaicing (converting the Bayer sequence into full color), applying a gamma curve, often with an additional tonal response curve, color correction and white balance, reducing noise, and sharpening the image. These operations affect Imatest measurements, especially sharpness (MTF or SFR).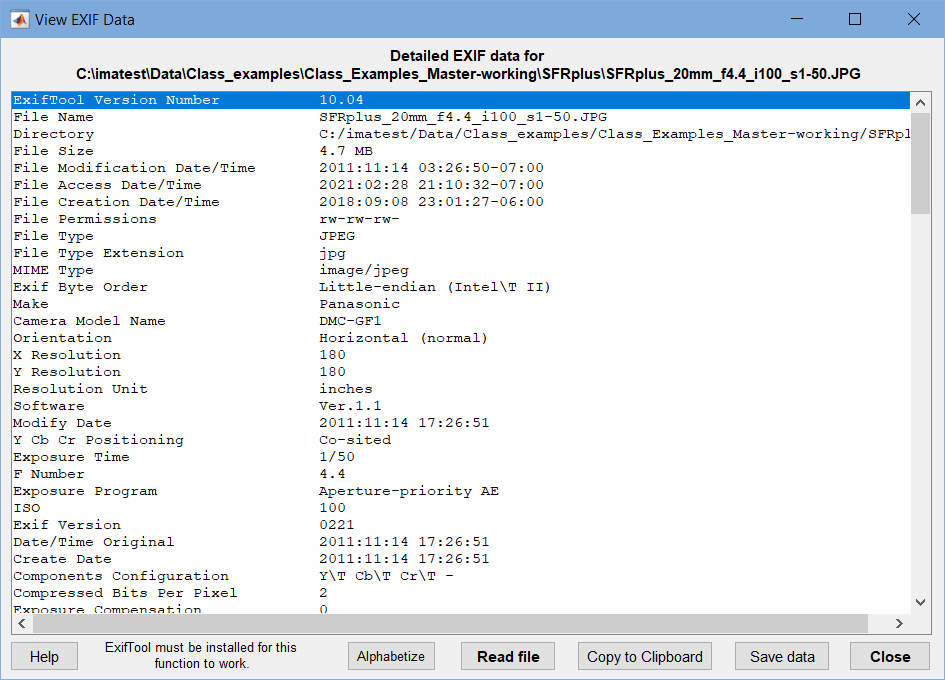
 Try the technique in A module that formerly worked has stopped working, also described in Troubleshooting. Essentially, you open the INI file editor, select the section corresponding the the broken module (for example, [sfplus]), delete the section, then Save the results. This initializes the settings for the section (you'll have to reenter them), but often fixes bugs caused by a bad ini setting.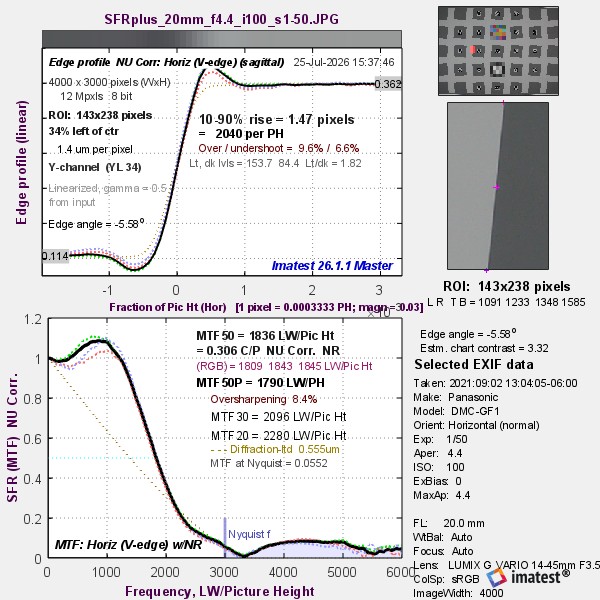
 , is shown.
 is particularly useful. Clicking on it highlights it and enables you to zoom in on regions of the plots. You can click and drag to create a zoom rectangle or you can click on any point to zoom in on that point. Double-clicking anywhere inside the image restores the full unzoomed image.