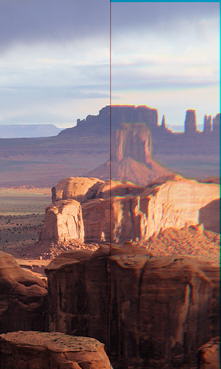
Image quality is one of those concepts that's greater than the sum of its parts. But you can't ignore the parts if your goal is to produce images of the highest quality. Every image quality factor counts.
This page introduces the key image quality factors and briefly describes how Imatest™ measures them— with links to detailed pages. It is a guide to Imatest organized by image quality factors. Other guides include the Imatest documentation (the Table of Contents).
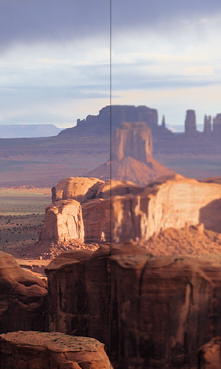
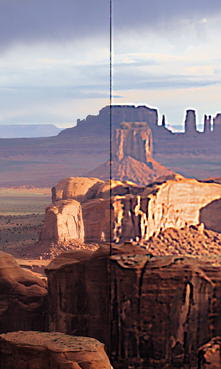
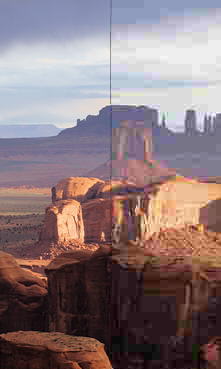
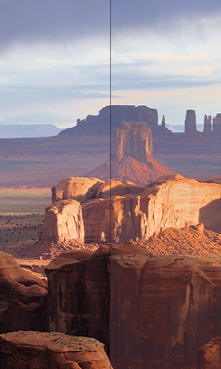
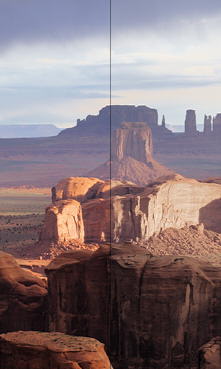
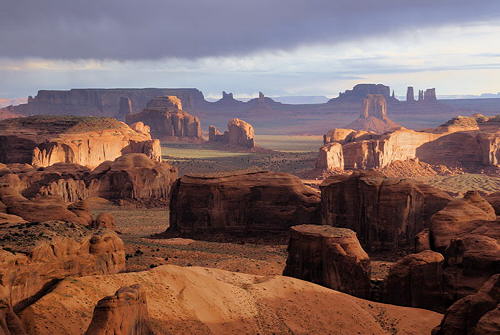
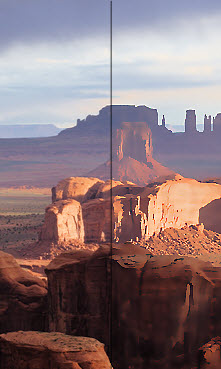
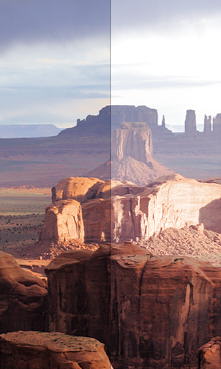
To illustrate the quality factors, we use this early morning image of Monument Valley from Hunt's Mesa, near the Arizona-Utah border.
Image quality measurements are affected by the
Lens — Imatest cannot measure lenses by themselves, but lenses can be effectively compared to one another using a single camera body with consistent image processing settings.
Sensor — Imatest can measure the performance of the Lens+sensor from minimally-processed RAW images if they are available. Sharpness, distortion, vignetting, Lateral Chromatic Aberration, noise, and dynamic range are the principal factors that can be measured at this stage. Most of these measurements can be clearly classified as good/bad.
Image processing pipeline— typically includes demosaicing, color correction, white balance, application of gamma and tonal response curves, sharpening, and noise reduction— all applied to JPEG images from cameras. Many of these functions can be simulated with the Image Processing module. The output of the pipeline may be compared to the minimally-processed images from converted RAW images. The effect of the pipeline on subjective image quality can be highly scene- and application-dependent, making it difficult to assign "good" or "bad" rankings. Imatest results for these factors need to be interpreted carefully. Examples:
Higher contrast images often score higher in visual quality assessment tests, but high contrast can cause clipping (visible as burnt-out highlights) in contrasty (often sunlit) scenes. Tonal response curves with "shoulders" can help. See Color/Tone Interactive, Color/Tone Auto, and Stepchart.
Most consumers find accurate color to be boring, so camera manufacturers "enhance" colors in a number of ways, such as boosting chroma. See Color/Tone Interactive, Color/Tone Auto, and Colorcheck.
Most consumers dislike noisy images, but software noise reduction (typically lowpass filtering in areas that lack contrasty features) can remove fine texture, resulting in a cartoon-like "plastic" skin appearance. See Log F-Contrast and Random/Dead Leaves.
Summary table
This table summarizes the Image Quality Factors (also called Key Performance Indicators; KPIs) described in detail below. Most of the charts are available from Imatest Store.
Excellent figure of merit for cameras. Combines sharpness, noise, and artifacts. Measures signal and noise at same location. See Shannon information capacity.
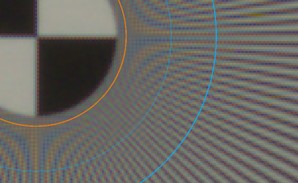
A color aliasing metric, derived from color moiré in wedges, has been added to Imatest 5.2. Color moiré is visible (but not measurable) in Log F-Contrast.
Notes: [1] Not available in Imatest Studio. Available in Master. [2] can be printed from Test charts, but we recommend purchasing it from the Imatest Store.
Image Quality Factors (KPIs) for cameras and lenses
Image Quality Factors are also called Key Performance Indicators (KPIs).
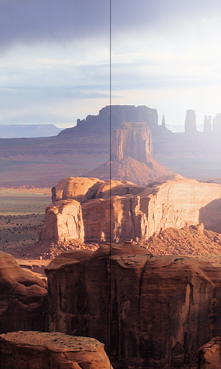
Sharpness is arguably the most important single image quality factor: it determines the amount of detail an image can convey. The image on the upper right illustrates the effects of reduced sharpness (from running Image Processing with one of the Gaussian filters set to 0.7 sigma).
Device or system sharpness is measured as a Spatial Frequency Response (SFR), also called Modulation Transfer Function (MTF). MTF is the contrast at a given spatial frequency (measured in cycles or line pairs per distance) relative to low frequencies. The 50% MTF frequency correlates well with perceived sharpness— much better than the old vanishing resolution measurement, which indicated where the detail wasn't.
The perceived sharpness of a print or display is measured by Subjective Quality Factor (SQF) or Acutance, which are derived from MTF, the Contrast Sensitivity Function of the human eye, and viewing conditions.
Several alternative patterns, which cause cameras to apply differing amounts of sharpening and noise reduction, can be used for measuring MTF. All require more real estate than the slanted-edge. They include
Original | BlurredLog Frequency, which uses a sine pattern chart that increases in frequency logarithmically. It provides a check on the slanted-edge method. More direct but less accurate,
Log F-Contrast, excellent for examining loss of detail due to noise reduction,
Star Chart, a multi-directional sinusoidal pattern,
Random/Dead Leaves, which measures texture sharpness. The Scale-invariant random pattern minimizes sharpening and maximizes noise reduction. The Dead Leaves pattern is more representative of typical images.
System sharpness is affected by the lens (design and manufacturing quality, position in the image field, aperture, and (for zoom lenses) focal length), sensor (pixel count and anti-aliasing filter), and signal processing (especially sharpening and noise reduction). In the field, sharpness is affected by camera shake (a good tripod can be helpful), focus accuracy, and atmospheric disturbances (thermal effects and aerosols).
Some lost sharpness can be restored by sharpening, but sharpening has limits. It can't restore detail where MTF is very low (under about 10%). Oversharpening, illustrated on the right, can also degrade image quality (especially at large magnifications) by causing "halos" to appear near contrast boundaries. Images from many compact digital cameras and phones are oversharpened.
Texture detail
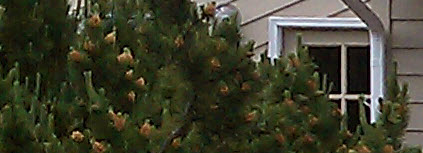
Many consumer cameras, especially cameras with small image sensors or pixels (mobile imaging devices and point-and-shoots), have signal processing that varies over the image plane. Sharpening is applied near contrasty features (like edges), but noise reduction (lowpass filtering) is applied— often strongly— the absence of sharp features, resulting in loss of texture detail. Such cameras will perform well on slanted-edge tests while producing unsatisfactory images. To emphasize this we show a real camera phone image, where the window and shingles have been strongly sharpened, but texture in the pine shrubs has been completely lost.Imatest measures texture sharpness in two modules:
Log F-Contrast, which relates pattern contrast to texture loss, and
Random/Dead Leaves, which supports two types of chart. The Scale-invariant random pattern minimizes sharpening and maximizes noise reduction. The Dead Leaves pattern is more representative of typical images. The Dead Leaves pattern has attracted considerable attention from the industry, particularly from the Camera Phone Image Quality (CPIQ) group. Imatest's new Spilled Coins (Dead Leaves) chart has several strong advantages over existing charts.
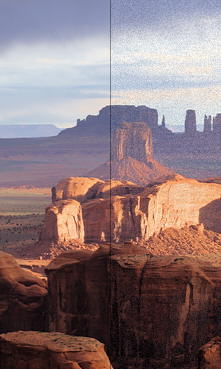
Noise is a random variation of image density, visible as grain in film and pixel level variations in digital images. It arises from the effects of basic physics— the photon nature of light and the thermal energy of heat— inside image sensors and amplifiers.
Noise scales strongly with pixel size. It can be very low in digital SLRs, which have pixels at least 4 microns square. But it can get ugly in compact digital cameras and camera phones with tiny sensors, especially at high ISO speeds or in dim light. It is also affected by sensor technology and manufacturing quality.
Original | Noise added
Software noise reduction (NR) reduces the visibility of noise by smoothing the image, excluding areas near contrasty boundaries. This technique works well, but it can obscure fine, low contrast detail. The Log Frequency-Contrast module clearly measures the effects of software noise reduction. The Random/Dead Leaves module uses a pattern that tends to maximize noise reduction (it's the worst-case for noise reduction)— in contrast to the slanted-edge (the opposite limiting case), which tends to maximize sharpening and minimize noise reduction.
Information capacity and metrics
Shannon information capacity is a powerful figure of merit for imaging systems that combines sharpness, noise, contrast, and degradations from several types of artifact (aliasing, data compression, and clipping). It is measured from Siemens star or slanted edge images. Signal and noise are measured at the same location, minimizing errors from bilateral filtering (nonuniform image processing). Units are (information) bits per pixel or total image. The related image information metrics (especially SNRi and Edge location σ) are particularly valuable for predicting the performance of machine vision and artificial intelligence systems.
Information metrics: Information capacity, NPS, NEQ, SNRi, Edge location σ, Object visibility
Imatestcan conveniently measure several Image Quality Factors related to information capacity. Some of these factors that have been used for medical imaging, but are unfamiliar outside it. They can be measured with any of the slanted-edge modules, with recommended chart contrast of 4:1.
Object visibility for squares with 1, 2, 3, 4, 7, 10, and 14 pixel sides with Michelson contrast of 0.6, 0.3, and 0.15 are shown on the right.
Noise Power Spectrum (NPS) — provides important information for calculating additional figures of merit.
Noise Equivalent Quanta (NEQ) — a frequency-dependent SNR, important in medical imaging.
Ideal observer Signal-to-Noise Ratio (SNRi) — measures detectability of small objects.
Object location standard deviation (σ) — describes how well the edges of the object can be located.
Object visibility — of small/low contrast objects. Related to SNRi.
Tonal response isthe relationship between light and pixel level (shown below). Contrast, also known asgamma, is the average slope of the (logarithmic) tonal response curve, excluding the lightest and darkest regions. High contrast (shown on the right) usually involves loss of dynamic range— loss of detail, or clipping, in highlights or shadows— when the image is displayed. (Image files often have greater dynamic ranges than display media can reproduce.)
Tonal response curves are measured in modules that support grayscale charts, including Color/Tone Interactive, Color/Tone Auto, Stepchart, Colorcheck, as well as multipurpose modules SFRplus and eSFR ISO. A response curve(log pixel level vs. log exposure) with a relatively constant contrast (straight slope) is shown below. Many consumer cameras apply a "shoulder" to the response— a region of reduced slope (a gradual flattening) in the highlights, which improves pictorial quality by reducing harsh highlight clipping (even though the image is technically less accurate). For this reason it's not easy to define a "good" or "bad" tonal response: it depends on the application.
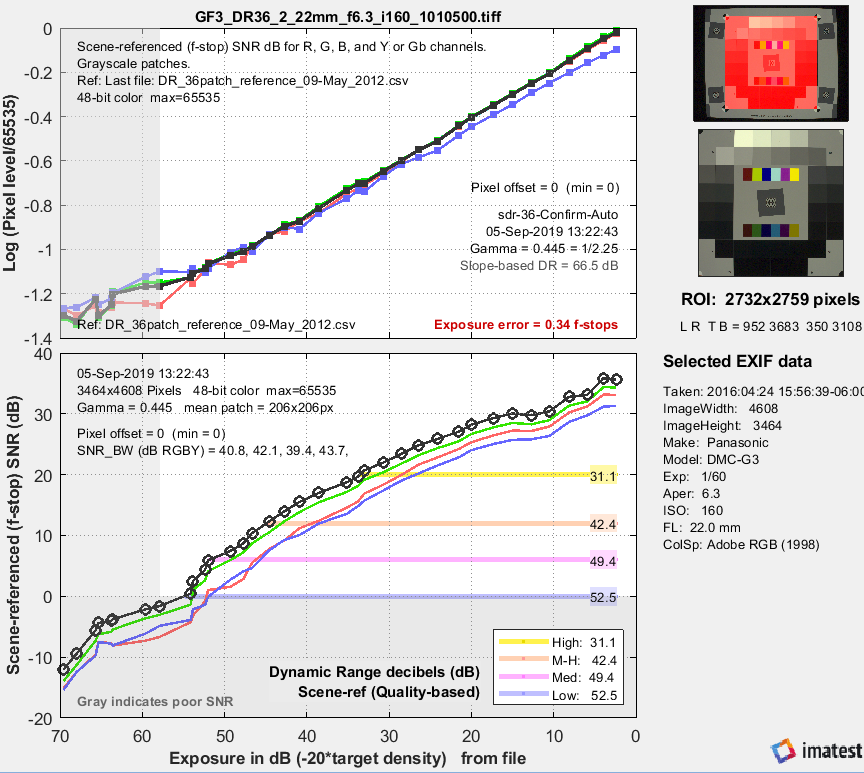
Dynamic range (DR) is the range of light levels a camera can capture with good contrast and Signal-to-Noise Ratio (SNR). It is measured in f-stops, EV (exposure value), or zones (factors of two in exposure), dB (decibels) or OD (Optical Density units). It is closely related to tonal response and noise: high noise implies low dynamic range.
The Dynamic Range page contains a detailed description of DR measurements and techniques.
Color/Tone Tonal response, showing Dynamic Range at several quality (SNR) levels. Click on image to view full-sized.
In real-world cameras, DR is limited by flare light in lenses (veiling glare)— light originating inside or outside the lens's field of view that bounces between lens elements and the interior barrel— which fogs the image and obscuring shadow detail.
Dynamic range is a strong function of sensor pixel size, which is proportional to the number of electrons a pixel can store. It should always be measured at a camera's lowest ISO speed (Exposure Index).
Displaying images with large dynamic ranges (which can be well over 1000:1; 10 f-stops) can be problematic with reflective media, which has a maximum dynamic range of about 100:1 (a little over 6 f-stops; 200:1 at the absolute maximum). Reducing contrast can make the image look flat and dull. Some processing, which affects measurements, is usually required. Examples are applying a shoulder to the tonal response and tone mapping (which can be simulated with the Image Processing module). The Contrast Resolution chart and analysis are designed to produce reliable results with tone-mapped images.
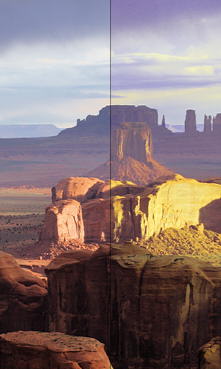
Color accuracy is an important but ambiguous image quality factor. It can be critical in medical and technical photography, but less so in pictorial (consumer) photography, where many viewers prefer enhanced color saturation, particularly in "memory colors": foliage, sky, and skin. Accurate color is not the same as "pleasing" color.
Whatever the application, it is important to measure a camera's color response: its color shifts, saturation, and white balance effectiveness. Color difference measurements are described in Wikipedia and in the Color/Tone and Colorcheck appendix.
Color accuracy may be measured against standard chart reference values or CSV reference files that contain measured color values, which may be altered to reflect customer preferences. Measuring color patches is described here.
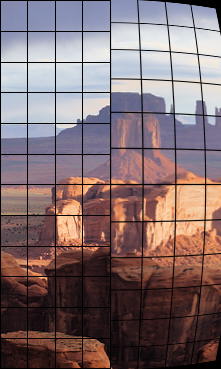
Lens (optical) distortion is an aberration that causes straight lines to curve near the edges of images. It can be troublesome for architectural photography and photogrammetry (measurements derived from images). The simplest approximation is the 3rd order equation, where ru is the undistorted and rd is the distorted radius. Depending on the sign of k, it can be either "barrel" (shown on the right) or "pincushion." A mixture known as "mustache" distortion may occur for complex lenses when the coefficients of the 5th order approximation () have opposite signs.
Distortion: methods and modules is a good introduction to distortion. It lists the mathematical models, modules used to measure distortion, and illustrates results.
Distortion is worst in wide angle, telephoto, and zoom lenses. It often worse for close-up images than for images at a distance. It can be easily corrected in software. The Imatest Radial Geometry module, Picture Window Pro and PTLens have tools for removing it.
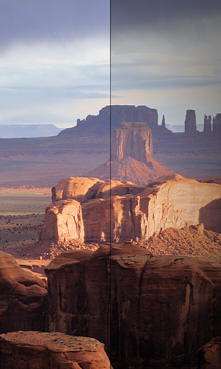
Light falloff (vignetting) darkens images near the corners. It can be particularly strong with wide angle lenses. It is measured by Flatffield and Flatfield-Interactive (an interactive module designed to work with direct image acquisition).
Light falloff often improves when lenses are stopped down. It can be easily corrected in software or in the image processing pipeline. Picture Window Pro, PTLens, and several other programs have tools for removing it. Because moderate amounts of light falloff can be pictorially pleasing, it's not always advisable to remove it completely.
Flatfield also measures other sensor nonuniformities, including color shading (nonuniformity), stuck (hot and dead) pixels, local sensitivity variations, spots (from dust), and noise.
Original | Vignetted
Blemishes (visible sensor defects)
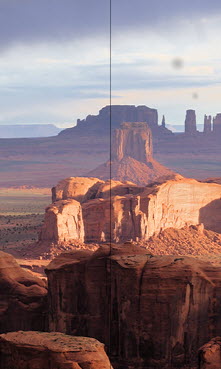
Blemishes are visible spots or marks in the image, caused by sensor defects or by dust in front of the sensor (typically separated by the Bayer, anti-aliasing, and infrared (IR) filters). They are extremely important in manufacturing. They are measured by Flatfield Blemish Detect (in Imatest Master).
Blemish Detect filters the image using a transfer function that is similar to the Contrast Sensitivity Function of the Human Visual System. Because of this, when filter parameters are set up properly, visible blemishes will be flagged and blemishes beneath the threshold of visibility will be ignored. This can significantly improve manufacturing yields.
▶Image Quality Video Series: ISO Sensitivity & Exposure Accuracy
Exposure accuracy is not much of a problem with manually-adjustable cameras where it can be easily determined (with the help of the histogram), and fixed using exposure compensation. But it can be an issue with fully automatic cameras and with video cameras that offer little opportunity for post-exposure tonal adjustment.
Exposure accuracy can be measured by photographing a scene that includes any test chart with a grayscale pattern and analyzing it with Stepchart (for grayscale stepchart-only patterns such as the Q-13/Q-14), Colorcheck (for the X-Rite Colorchecker), Color/Tone Interactive or Color/Tone Auto (for any chart with a grayscale pattern).
Original | Overexposed
ISO Sensitivity (closely related to exposure accuracy) is a measure of a camera's sensitivity to light. Imatest modules that analyze step charts (which may be included in color charts) display two measures of sensitivity when the incident light in Lux is entered. Details in ISO Sensitivity and Exposure Index.
Lateral chromatic aberration (LCA), also called "color fringing" is a lens aberration that causes colors to focus at different distances from the image center. It is most visible near corners of images. It is explained in Chromatic aberration.
LCA is worst with asymmetrical lenses, including ultrawides, true telephotos and zooms. It is strongly affected by demosaicing. It can be fully corrected in software prior to demosaicing, but only partially corrected afterwards. Picture Window Pro has a fairly effective transformation. In the future, information provided by Imatest (detailed LCA profiles) may improve the degree of correction.
Original | Color-fringed
Veiling glare (lens flare)
Veiling glare is stray light in lenses and optical systems caused by reflections between lens elements and the inside barrel of the lens. It predicts the severity of lens flare— image fogging (loss of shadow detail and color) as well as "ghost" images— that can occur in the presence of bright light sources in or near the field of view. (It does not measure the ghosts in detail.)
Veiling glare is measured by
Stepchart using a standard Kodak Q-13 or Q-14 step chart mounted beside a "black hole," i.e., a box lined with black behind a small opening, mounted on a large white board, as described in detail in Veiling glare.
Veiling glare can only be measured reliably with RAW images, preferably decoded with gamma = 1, because image processing (especially conversion to sRGB color space) can affect the "toe" region of the tonal response curve, which is critical to veiling glare measurements. Special care must be taken to distinguish pixel offsets (minimum pixel levels in sensor or camera outputs— built into some video/cinema color spaces such as Rec. 709) from flare light.
Lens flare is a major factor in limiting practical camera Dynamic Range. The Contrast Resolution chart and module are especially valuable for measuring true Dynamic Range in the presence of flare.
Original | Veiling glare
Color moiré (aliasing)
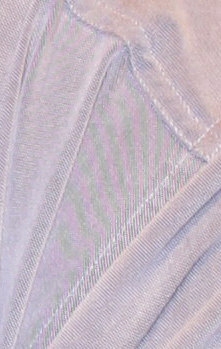
Color moiré is color banding that can appear in images that have high spatial frequency repetitive patterns, such as fabrics or picket fences. The example on the right is a detail of a shirt captured by the Canon Rebel XT with its sharp kit lens. The usual image wasn't used because it doesn't contain a repetitive pattern that illustrates color moiré.
Color moiré is an artifact that results from aliasing (image energy above the Nyquist frequency) in image sensors that employ Bayer color filter arrays. It is explained in detail in Nyquist frequency, aliasing, and Color Moire. It is affected by lens sharpness, the sensor's anti-aliasing (lowpass) filter (which softens the image), and demosaicing software. It tends to be worst with the sharpest lenses.
Color moiré is measured from hyperbolic wedges using the eSFR ISO and Wedge modules. A new Color moiré metric has been added in Imatest 5.2: the maximum value of the mean of CIELAB Chromameasured inside the wedge.
Several important phenomena appear when a lens is defocused or the distance to the object is changed without changing the lens focus. Measuring them requires several images acquired at different distances (recommended) or different focus settings (difficult to accomplish repeatably). Multiple images can be used to measure
Depth of Field (DoF),
Curvature of field,
Longitudinal (axial) chromatic aberration, and
Lens focal length (when used with the motorized modular test stand, which can be set for precisely-controlled distance steps).
To make these measurements you'll need to acquire batches of SFRplus, eSFR ISO, or Checkerboard images and process them with the FocusField postprocessor. Here is an animated GIF of the results.
Original | Defocused
Image Processing artifacts: noise reduction and sharpening
Software (especially operations performed during RAW conversion) can cause significant visual artifacts, including oversharpening "halos" and loss of fine, low-contrast detail. These artifacts result from nonlinear (nonuniform) signal processing (so-called because it varies with the signal). Images may be sharpened (MTF boosted) in the proximity of contrasty features like edges and blurred (lowpass filtered) in their absence. This is most often done with Bilateral filtering, which can be simulated with the Image Processing module. This generally improve measured performance, but may result in a degradation of perceived image quality, for example, a "plasticy" cartoon-like appearance of skin even though edges are strongly sharpened.
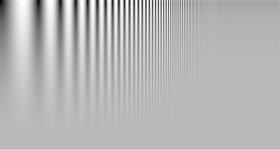
This loss of detail can be measured by the Log F-Contrast module, which analyzes the chart shown on the left, which varies logarithmically in spatial frequency on the horizontal axis and in contrast on the vertical axis. The Random/Dead Leaves module is also useful for observing and measuring artifacts: a particularly egregious case is presented here.
The effects of several types of artifact: aliasing (from demosaicing), data compression, and clipping (saturation) can be measured with Shannon information capacity using the Star module.
Original | NR+Sharpening
Data compression and transmission losses
Data compression and transmission losses can have a significant effect on image quality. The right side of the image on the left has been saved as a low quality JPEG. Banding, loss of low-contrast detail, and "waviness" near edges are visible.
Some of these losses, especially the loss of low-contrast detail, can be analyzed with the Log F-contrast and Random/Dead Leaves modules.
The SSIM module provides a detailed measurement of compression/transmission losses using two images: a processed and a reference image. The images must be derived from the same capture and must have the same pixel size. Any arbitrary image can be used with this module, including images of several Imatest test charts, especially the two mentioned in the above paragraph. The Image Processing module also contains an SSIM calculation.
Note: Many of Print Test's functions are now performed by Gamutvision. Print Test has been deprecated (nobody was using it.)
Print Dmax
Dmax = -log10(minimum print reflectivity) is a measure of the deepest black tone a printer/ink/paper combination can reproduce. It is an extremely important print quality factor. Prints with poor Dmax look pale and weak. Dmax = 1.7 is a good value for matte prints; 2.0 is a good value for glossy, semigloss, and luster prints. There have been reports that Epson Ultrachrome K3 printers have Dmax as high as 2.3 with Premium Luster paper. That would be outstanding.
Dmax is measured by Print Test, along with the Printer's tonal response curve and the color factors described below. Print test requires a decent flatbed scanner, and for best accuracy, a Step chart.
Dmax is affected by the printer, paper, and ink. The response curve is also affected by the ICC profile. Print Test can help with the selection of supplies and diagnosis of printing problems.
Original | Reduced Dmax
Print color gamut
Print color gamut is the range of colors a printer/ink/paper combination can reproduce. It is an important quality factor, though its importance may be somewhat overrated. (This statement is bound to generate controversy.) Relatively unsaturated colors such as skin tones dominate our impression of print quality. Such colors must be reproduced accurately. Gamut affects only highly saturated colors. Overall color response, especially for low to moderately saturated colors, is more important than gamut.
Print color gamut and overall color response are measured by Print Test, along with the density factors described above.
Print gamut is affected by the printer, paper, ink, and working color space. Color response is also affected by the ICC profile and rendering intent. Print Test can help with the selection of profiles, software settings, and the diagnosis of color problems.
 ▶
▶

 Imatest measures texture sharpness in two modules:
 ▶
▶
 Shannon information capacity is a powerful figure of merit for imaging systems that combines sharpness, noise, contrast, and degradations from several types of artifact (aliasing, data compression, and clipping). It is measured from Siemens star or slanted edge images. Signal and noise are measured at the same location, minimizing errors from bilateral filtering (nonuniform image processing). Units are (information) bits per pixel or total image. The related image information metrics (especially SNRi and Edge location σ) are particularly valuable for predicting the performance of machine vision and artificial intelligence systems.
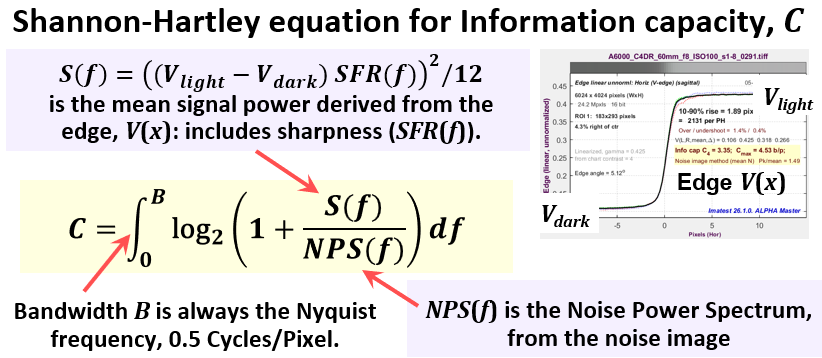 The best introduction to information metrics is a White Paper, revised and updated from Electronic Imaging 2024, Image information metrics from slanted edges .
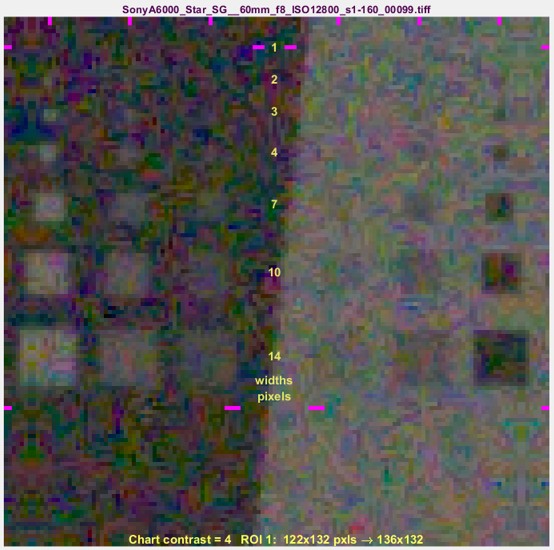 Information metrics: Information capacity, NPS, NEQ, SNRi, Edge location σ, Object visibility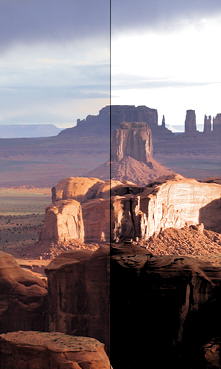
 ▶
▶
 Original | Color-shifted
 ▶
▶ ▶
▶
 ▶
▶
 ▶
▶
 ▶
▶