문서 - 현재 버전 26.1

목차 색인
이미지 품질  
Imatest로 측정한 IQ 요소(KPI)와 자세한 설명 및 지침 링크입니다.
날카로움 선명도 및 선명도 조정 소개; 다양한 차트 비교; 차트 품질의 한계 및 극복 방법
기타 IQ 요인  잡음, 신호 대 잡음비(SNR), 시간적 잡음, 동적 범위(DR), 색수차, 왜곡, 베일링 현상, 섀넌 정보 용량 및 이미지 정보 측정 지표 등
시작하기 Imatest를 선택하는 이유, 테스트 차트, 조명, 이미지 캡처 기술, 실험실 설정, Imatest 소프트웨어 사용법
Imatest 소프트웨어 사용을 시작하세요 설치, Imatest 사용법, 이미지 파일 형식 및 장치, 활성화/비활성화
일반 지침 특수 표준, 지원 장치, 테스트 관리자, 원시 파일, 테스트 랩, INI 파일, 합격/불합격 모니터
출력 문서 선택된 JSON, CSV 및 XML 출력에 대한 설명
이미지 획득 이미지 획득을 위한 파일, 형식, 장치 및 유틸리티
지식 기반 주요 내용 문제 해결, 활성화 및 일반적인 작동 관련 조언에 대한 링크입니다.
문제 해결 Imatest가 예상대로 작동하지 않을 때 해야 할 일
Simatest 카메라/ISP 시뮬레이터 Simatest – 영상 신호 처리/카메라 시뮬레이터 – 예제 – 이미지 센서 노이즈
IQ 유틸리티 SSIM, 이미지 통계, 방사형 기하학
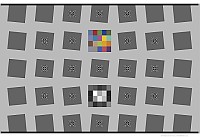
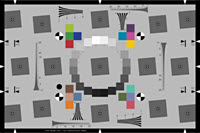
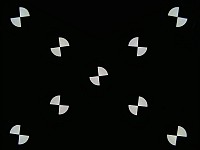
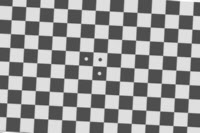
경사진 모서리 선명도 모듈 SFR (수동 ROI), SFRplus , eSFR ISO , SFRreg , 체커보드 (자동 ROI 감지)
여기서는 4가지 자동 감지 경사 모서리 선명도 모듈을 비교합니다.
기타 선명도 모듈 로그 F-대비, 별 모양, 무작위/낙엽/쏟아진 동전, 쐐기 모양, 선명도 유틸리티 및 후처리
선명도 유틸리티 및 후처리 프로그램 MTF 비교, 이미지 안정화, 배치 보기, ShGarpest 파일 찾기
톤, 색상, 노이즈 및 다이내믹 레인지 모듈 색상/톤(대화형 및 자동), CCM(색상 보정 매트릭스), CDP, 명암 해상도, 색상 검사, 스텝 차트, 측정 패치, ICC 색상 프로파일 및 색역 매핑 평가를 위한 Gamutvision .
공간 및 평면 필드 모듈 플랫필드, 플랫필드 인터랙티브, 왜곡, 도트 패턴, 테스트 디스플레이
기타 모듈 및 유틸리티 조명 제어, 임의 차트, 장치 관리자, 자동 화이트 밸런스/노출/초점(AWB, AE, AF), 테스트 차트 인쇄 및 표시, 파일 이름 변경, 교육용 앱, 데이터베이스
산업 테스트 에디션 모듈, 다양한 인터페이스(EXE, C, C++, Python, .NET) 사용 설명서, INI 파일 참조, 합격/불합격 여부 표시, 운영자 콘솔, 속도 향상 기능
충수 자주 묻는 질문(FAQ), 버전, 문제 해결, 변경 로그, INI 파일 참조, 라이선스

이미지 품질

일반 — 영상 품질 요소(핵심 성과 지표 – KPI) 소개

이미지 품질 요소 – 개요 및 Imatest 측정 결과 (시작하는 데 권장).

서론 - 요약표 - 이미지 품질 요소 - 선명도 - 질감 - 노이즈 - 정보 용량 및 측정 기준 - 톤 응답 - 다이내믹 레인지 - 색 정확도 - 왜곡 - 균일성 - 잡티 - 노출 정확도/ISO 감도 - 측면 색수차 - 산란광(플레어) - 베일링 글레어 - 색상 모아레 - 소프트웨어 아티팩트 - 데이터 압축 - 프린터 품질 요소

날카로움
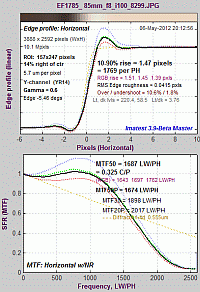
선명도 란 무엇이며 어떻게 측정하는가?

소개 - MTF - MTF 방정식 - 공간 주파수 단위 - 요약 지표 - MTF 측정 매트릭스 - 측정 기법 비교 - 경사 가장자리 측정 - 경사 가장자리를 사용하는 이유 - 클리핑 - 노이즈 감소 - MTF50 해석 - 자동 초점(AF) 속도 - 계산 세부 정보 - 경사 가장자리 알고리즘 - Imatest와 ISO 계산 비교 - 링크

선명도 조정 - 카메라 비교를 위한 표준화된 선명도 조정

소개 - 예시 - 과도한 선명도/덜 선명도 - 예시 - 언샤프 마스킹(USM) - 링크 - 표준화된 선명도 조정

서로 다른 카메라의 선명도 비교 - 적용 분야: "이미지 중심"(그림 이미지용) 또는 "객체 중심"(의료, 머신 비전 등용)은 이미지 비교 방식에 큰 영향을 미칩니다.

Imatest 경사 모서리 계산의 유효성 검증

경사형 엣지 센서와 지멘스 스타 센서 의 신호 처리 감도 비교

소개 - 이미지 - 원본 결과 - 사선 모서리 결과 - 정현파(로그 F-대비 및 지멘스 스타) 결과 - 극단적 선명도 조정 - 요약 - 결론

경사형 엣지 카메라와 지멘스 스타 카메라 비교, 2부- 추가 카메라 4대에 대한 결과

경사 모서리 방식과 지멘스 스타 방식의 MTF 계산 비교: 2024년 백서

경사면 측정의 일관성 및 반복성 - 다양한 ISO 속도 및 ROI 크기 비교. 불완전하지만 여전히 유용합니다.

나이퀴스트 주파수, 에일리어싱 및 컬러 모아레 - 웨지에서 파생된 컬러 에일리어싱 측정 방법을 소개합니다.

회절, 최적 조리개 및 초점 흐림 - 렌즈 수차 - 회절 - 픽셀 응답 한계 및 Q - 초점 흐림 

디스플레이(모니터) 선명도 - 차트 표시 - 이미지 캡처 - 분석 - 결과 - TV 라인 - 감마 모니터링 - CMS 시스템

카메라 모니터 시스템(CMS) - 자동차 백미러 교체 시스템 및 일부 내시경용

경사진 모서리 MTF 측정에 대한 LSF(선 확산 함수) 보정 계수

경사진 모서리 MTF 측정에서 모서리에 수직 방향으로의 불균일성에 대한 불균일 조명 보정

차트 및 센서 MTF에 대한 카메라 MTF 측정값 보정

소개 - 계산 - MTF 보정 파일 - 보정 적용 - 렌즈 MTF 측정을 위한 센서 MTF 보정 - 차트 MTF 측정

차트 품질 계산기 - 특정 용지 및 인쇄 방식에 대한 MTF 측정값을 기반으로 특정 용도에 적합한 차트인지 판단합니다. 사용법이 다소 복잡할 수 있습니다. 아래의 차트 적합성 테스트를 권장합니다.
MTF 측정 적합성 테스트 차트 - 다양한 용지 유형(잉크젯 및 사진 용지, 반사형 및 투과형)의 MTF 측정 적합성을 판단하는 차트입니다. 차트 품질 계산기 결과를 기반으로 합니다.
암묵적 선명도 가정(회절) - 차트 적합성 표시 - 잉크젯 무광택지 - 흑백 사진 용지 - 컬러 LVT | 흑백 LVT - MTF 적합성 계산 
반사 차트 품질 비교: 잉크젯 방식 vs. 사진 방식
투과형 차트 품질 비교
MTF 곡선과 이미지 외관- 측정값과 외관의 상관관계
소개 - 사선 모서리 테스트 - 참조 이미지 - 선명하게 처리된 이미지 - 흐릿하게 처리된 이미지 - 선명하게 처리된 이미지 와 흐릿하게 처리된 이미지 - 관찰 결과 - 선명도 순위 - 관련 링크
선명도 및 SQF(주관적 품질 지수) : 지각적 선명도 측정
소개 - 선명도 및 MTF - 선명도 및 SQF의 의미 - 선명도 및 SQF 측정 - SQF 공식 - CSF - 관련 링크
 

기타 이미지 품질 요소

감마, 톤 응답 및 관련 개념 - 사용 이유, 측정 방법 등 다양한 정보
소개 – 인코딩 감마 vs. 디스플레이 감마 – 로그를 사용하는 이유 – 감마 인코딩이 동적 범위를 향상시키는 방법 – 예상 감마 값 – 감마와 MTF – 감마 계산에 사용되는 패치 – 감마 ≅ 2.2인 이유 – 톤 매핑 – 명암비: 비율 ,웨버 , 미켈슨 – 로그 색 공간 – 모니터 감마
사진 이미지의 노이즈 
소개 - 불균일성 보정 - 측정 - SNR_BW - 외관 - 요약 - 조리개 값에 따른 노이즈, 장면 참조 SNR 및 동적 범위 - 시간적 노이즈 - ISO 15739 - 노이즈의 수학적 원리 - 원본 노이즈와 디모자이킹된 노이즈 비교 - 스펙트럼 - 링크
시간적 잡음 - 두 이미지 측정과 다중 이미지 측정 비교
동적 범위 - 이를 계산하는 Imatest 모듈 링크를 포함한 일반적인 소개입니다.
센서 vs. 시스템 DR – 플레어, 차트, 노출 – DR 정의 – 투과형 차트 – 라이트박스 – DR 측정 방법 – 반사 최소화 – 명암비 해상도 차트 – 팁 및 권장 사항 – 오프셋 –플레어 추가 정보 – 플레어 현상 – DR 제한 – F-스톱 노이즈 및 장면 참조 SNR
색수차 - (측면 색수차) 일명 색 번짐
소개 - 측정 - 디모자이킹 - 비접선 가장자리 보정 - 보라색 테두리 현상
왜곡 - 방법 및 모듈   왜곡 공식-모듈-TV 왜곡 및 시야각-결과 비교
세 가지 광학 중심 – 선명도, 조명 및 왜곡의 중심

미광(플레어)

소개 - 출력 - 예시 - 원인-테스트 개요-테스트 요소 - 마스터 및 IT 지침-정규화된 산란광 지침-설정-계산-정규화 방법 - 광원 마스크 방법 
가리는 눈부심
서론 - 목표 - 스텝차트 측정 - 결과 - ISO 9358 - ISO 18844 균일도 및 대비 분해능 측정 (2회 노출법)
색상 보정 매트릭스
소개 - 수학 - 색상/톤 상호작용 - 채도 - 행렬 적용
ISO 감도 및 노출 지수
소개 – 입사광 측정 – 모듈 – 방정식 – 원본 파일 – 포화도 기반 – 표준 출력 – 관련 문서
정보 용량 관련 뉴스, 비디오 및 링크는 솔루션 - 이미지 정보 측정 페이지 에서 확인할 수 있습니다.

EI2024 논문인 " 기울어진 모서리에서 얻은 이미지 정보 측정법" 은 새로운 측정법에 대한 훌륭한 소개입니다.

2023-2024년에 발표된 두 편의 백서에는 에지 SNRi 및 필터 설계 등 최신 정보 용량 측정 결과 및 내용이 담겨 있습니다.

《이미지 정보 측정법 개론》 은 이미지 정보 용량 및 관련 측정법에 대한 가장 간결한 소개서로, 최소한의 공식과 기술적 세부 사항만을 다룹니다.

Imatest의 이미지 정보 측정은 이미지 정보 용량 및 관련 측정에 대한 중급 수준의 소개입니다.

이미지 정보 측정 및 응용: 참고 자료  (41페이지 분량의) 이 문서에는 모든 방정식과 기술적 세부 사항이 포함되어 있습니다. 더 짧은 문서들의 참고 자료입니다.

2020년에 도입된 지멘스 스타 방식은 속도는 느리지만 이미지 처리 아티팩트(디모자이킹, 데이터 압축 등)의 영향을 관찰하는 데 더 적합합니다.
 
정보 기반 동적 범위- 1부: 소개 - 2부: InfoDR 활용 - 3부: 결과
지멘스 별의 섀넌 정보 용량(2020)- 선명도와 노이즈를 결합한 성능 지표
의미 - 결과 - 요약
경사진 모서리에서의 정보 용량 측정: 방정식 및 알고리즘(2023-4)- 선명도와 노이즈를 결합한 성능 지표로, NPS, NEQ, SNRi를 포함하여 모든 경사진 모서리에서 편리하게 측정할 수 있습니다.
경사진 모서리의 정보 용량 측정: 지침(2023-4) - 새로운 계산 방법에 대한 지침.

이미지 품질 테스트 시작하기

Imatest를 선택하는 이유 | 테스트 차트 | 조명 | 이미지 캡처 기술 | 실험실 설정 | Imatest 소프트웨어 사용법 
GitHub에서 가져온 여러 모듈의 샘플 이미지

Imatest 소프트웨어 사용을 시작하세요

설치 및 시작하기
설치 - 구매 - 등록 - 오프라인 등록 - 파일
Imatest 사용법 - 시작하기 - 소개 및 일반 지침 (초보자에게 권장)
Imatest 워크플로 – 차트 및 모듈 선택 – Imatest 실행 – Imatest 도움말 찾기 – Imatest 메인 창 – 창 및 글꼴 크기 – 유용한 버튼 3개 – 원본 파일 – 기타 제어 및 유틸리티 – EXIF 표시 – ROI 옵션 – 옵션 II – EXIF 데이터 설정 – 드롭다운 메뉴 – 그림 – CSV 및 JSON 출력 – 라이선스 – 성공적인 테스트를 위한 팁
정보 측정 기준에 기반한 이미지 품질 테스트
이미지 파일 형식 및 획득 장치 - Imatest의 다양한 이미지 소스 - 이미지 파일을 제대로 읽지 못하는 경우 대처 방법
표준(교환 가능한) 이미지 파일 - YUV 및 기타 - RAW 파일 - 비디오 파일 - Imatest용 획득 장치
Imatest Image Master에서 지원하는 이미지 획득 하드웨어
고정형 모듈과 대화형 모듈
활성화/비활성화 - Imatest 활성화 및 한 컴퓨터에서 다른 컴퓨터로 옮기기
온라인 활성화 | 오프라인 활성화 | 온라인 비활성화 | 오프라인 비활성화 | 플로팅 라이선스 | 프록시 서버
기술 자료 - 활성화 문제를 해결하는 데 도움이 되는 여러 링크가 포함되어 있습니다.

Imatest 사용 설명서 - 일반

세션 로깅 - 표시 및 로그 파일에 대한 로그 레벨 제어
목표물 탐지 설정 - 기본 탐지 기능이 실패할 경우 목표물을 자동으로 탐지하도록 안내하는 설정입니다.
체커보드 - SFRreg
Skype 화상 통화 사양 지원 - 지침 및 제안
IEEE CPIQ(카메라폰 이미지 품질) 지원
SFR 및 선명도 - 색상 균일성 - 왜곡 및 색수차 - 질감
테스트 랩 구축- 테스트 랩을 구축하는 방법
소개 - 하드웨어 - 저비용 테스트 랩 구축 - 이젤 - 광량 측정 - 삼각대 - 클램프 - 조립 - 타겟 - 타겟과 카메라 정렬 
관심 영역(ROI) 저장 및 불러오기 - 나중에 사용할 수 있도록 ROI를 명명된 파일에 저장하고 불러오는 방법.
저장된 설정 - Imatest-v2.ini 및 Imatest IT에서 사용할 INI 파일
imatest-v2.ini - INI 파일 유틸리티 - INI 파일 편집기 - 사용자 정의 아이콘 생성 - 잠금 설정 
합격/불합격 모니터 - 합격/불합격 결과를 실시간으로 표시하고 업데이트합니다 ( Imatest IT 와 함께 사용 시 유용).
소개 - 설치 - 유틸리티

출력 문서

선명도 및 왜곡 모듈에 대한 내장 출력 문서
출력 문서 Google 스프레드시트
출력 문서 Excel 스프레드시트
산란광 및 동심원 고리 결과

이미지 획득 - 파일, 형식, 장치 및 유틸리티

장치 관리자 - 카메라에 연결하고, 설정을 조정하고, 이미지를 대화형 모듈로 가져옵니다.
Imatest Image Master에서 지원하는 이미지 획득 하드웨어
직접 이미지 획득 방식 사용 - 기기에서 직접 이미지 획득
ON Semi Devware Quickstart를 사용하여 직접 이미지 획득을 시작하세요.
Omnivision Quickstart를 사용하여 직접 이미지 획득을 시작하세요.
안드로이드 카메라 인터페이스를 이용한 직접 이미지 촬영
직접 이미지 획득용 Sony AYA 인터페이스
Semi DevWareX 인터페이스를 이용한 직접 이미지 획득
테스트 관리자
자동 배치 - 여러 모듈의 테스트 이미지를 하나의 장치에 대해 자동 배치 실행으로 결합합니다.
Imatest 기능 인터페이스 - 일관된 설정으로 테스트를 실행하기 위한 간소화된 인터페이스
기능 인터페이스 - 편집기 - INI 편집기를 사용하여 병합 파일 준비 (향후 릴리스에서 사용이 중단될 수 있음)
원본 파일 - Imatest 모듈은 원본 파일을 직접 또는 디모자이킹 후 분석할 수 있습니다.
소개 - RAW 파일 사용법 - Bayer RAW 및 RCCC 파일 - LibRaw 디모자이킹(상용 RAW 파일용) - Bayer 주파수 단위 - DNG 파일 - Rawview 유틸리티 - 일반화된 RAW 읽기(바이너리 RAW 파일용) - 압축 해제 - 합성 RAW 이미지 생성
 

기술 자료 주요 내용 - 문제 해결, 활성화 및 일반적인 작동 관련 조언에 대한 문서 링크입니다.

이전에는 정상적으로 작동하던 모듈이 작동을 멈췄습니다.
관심 영역(ROI) 선택 항목을 저장하고 불러오는 방법
2019년 Imatest 라이선스 업데이트 - 활성화를 위해 업데이트가 필요합니다
전체 지식 기반 에는 이와 같은 링크가 훨씬 더 많습니다.
 
문제 해결 - Imatest가 작동하지 않을 때 해야 할 일
충돌 보고 - 먼저 이 작업을 수행하십시오 - 설치 문제 - 버전 3.6 이상 변경 사항 - 설치 후 문제 - DLL 누락 - 런타임 문제 - 손상된 INI 파일 - 모듈 작동 중지 - 오류 보고 - 명령(DOS) 창 - 진단 실행 - 경로 충돌

Simatest ISP/카메라 시뮬레이터

Simatest: 개요 - Simatest 카메라/이미지 신호 처리(ISP) 시뮬레이터에 대한 간략한 소개: 이미지 센서 노이즈와 가장 일반적인 ISP 블록이 영상의 모양과 측정값에 미치는 영향을 보여줍니다. 2025년 2월부터 Simatest 시범 프로그램 에서 이용 가능합니다.
소개 – 블록 다이어그램 – 입력 파일 –Simatest 실행 – 설정 – 이미지 처리 블록 –결과 – 비교 보기 – Simatest의 장점 – 저조도 분석 – 부록: 이미지 센서 노이즈 모델
Simatest: 사용 설명서 및 참고 자료 - Simatest ISP/카메라 시뮬레이션에 대한 전체 참고 자료 
입력 파일 – Simatest 실행 – 설정 – 이미지 처리 블록 – 선명도 향상 – 이미지 센서 노이즈 – Simatest 실행 – 처리 과정 – 나란히 보기 – 결과 – 제어 – OCR – 얼굴 및 사람 감지
Simatest 사용 예시 - 이미지 센서 노이즈 측정 및 카메라와 ISP 성능 모델링에 Simatest를 사용하는 예시
Simatest 블록 다이어그램 – 이미지 센서 노이즈 모델링 – 노이즈 측정 –노이즈 시뮬레이션 – 이미지 선명도 모델링 및 측정 –이미지 선명도 시뮬레이션 – 카메라 JPEG 시뮬레이션
이미지 센서 노이즈 - 측정 및 모델링 - Simatest 에서 동적 범위 및 노이즈 측정을 위한 RAW 파일 사용
이미지 처리 (기존 모듈 - Simatest로 대체됨) - 이미지 처리 작업(열화 및 향상)을 시뮬레이션하고 외관 및 측정값에 미치는 영향을 관찰합니다. - 작동 - 이미지 처리 블록 - 표시 및 분석 - OCR - 얼굴 및 사람 감지

이미지 품질 유틸리티는 (테스트 차트뿐만 아니라) 모든 이미지를 저하시키거나, 향상시키거나, 검사하거나, 분석할 수 있습니다.

SSIM: 구조적 유사성 지수 - 압축과 같은 신호 처리로 인한 이미지 품질 저하 및 아티팩트를 측정합니다. 또한 PSNR도 측정합니다.
운영 - 옵션
이미지 통계 - 단면, 평균, 노이즈, SNR, 히스토그램 및 주파수 스펙트럼과 같은 이미지 통계를 대화형으로 관찰할 수 있습니다.
방사형 기하학 - 이미지의 왜곡, 측면 색수차 또는 회전을 추가하거나 수정합니다.

경사진 모서리 선명도 모듈

SFR – 경사진 모서리의 기본 분석(수동 ROI 선택)
SFR 사용법 1부 - SFR 타겟 설치 및 사진 촬영
사선 모서리 테스트 - 인쇄 차트 - 조명 - 거리 - 노출 - 팁 - 품질과 거리
SFR 사용법 2부 - Imatest SFR 실행
이미지 파일 - ROI - 자르기 권장 사항(ROI 크기) - 추가 입력 - 보조 판독값 - 방정식 - 감마 - 경고 - 저장 - 반복 실행 - Excel CSV 출력
Imatest SFR LCD 타겟
화면 패턴 모듈 - 웹 패턴
SFR 결과: MTF(선명도) 플롯
SFR 결과: - 색수차, 잡음 및 섀넌 용량 플롯
SFR 결과: 다중 ROI(관심 영역) 플롯
2D 요약 그래프 - 1D 요약 그래프 - CSV 출력 파일 - 요약 설명 - 엑셀 그래프

SFR 결과: 자동 초점(AF) 그래프


자동 영역 감지 기능 (대화형 또는 자동(배치) 분석) 을 갖춘 경사 모서리 MTF 모듈 표
모든 제품은 ISO 규격의 MTF(선명도) 분석 , 측면 색수차(LCA) 분석 , 그리고 ISO 표준 4:1을 권장하는 2:1~10:1의 차트 대비 비율에 대한 정보 용량을 지원합니다.
특징 SFR플러스
eSFR ISO
eSFRiso_enhanced_200W
SFRreg
옵티코스_메리디안_200W
서양 장기판
체커보드_이상적인_프레임-200W
선명도 맵 세부 정보 높은 중간 계약 내용에 따라 다릅니다 높은
ISO 표준 차트 디자인 – ♦ – –
색상 분석 ♦ ♦ (SFRreg 센터 차트에만 해당) –
음색 응답(OECF) ♦ ♦ (SFRreg 센터 차트에만 해당) –
소음 분석 제한된 ♦ 제한된 제한된
왜곡 ♦ 좋음 제한된– ♦ 최고
기하학 (회전,
시야각, 키스톤 등)
♦ ♦ – ♦
특징 및
권장 사용법
Imatest에서 자체적으로 감지하는 차트로, 2009년부터 사용되어 왔습니다. 견고하고 다용도로 활용 가능합니다. 상단 및 하단 막대 위아래에 여백을 두는 것이 좋습니다. eSFR ISO보다 공간 및 왜곡에 대한 세부 정보가 더 풍부합니다.
ISO 표준 차트 디자인. 웨지 분석 및 (선택 사항) 색상 패치를 포함합니다. 상세한 노이즈 분석을 지원합니다.

일반적으로 여러 개의 개별 차트가 이미지 영역 주변에 배치됩니다.
- 익스트림 어안 렌즈(>180°)
- 목표 투영 시스템
- 초점 및 심도 테스트를 위해 다양한 거리의 차트를 사용합니다.
- 초고해상도 카메라(>36MP)

프레임에 비교적 둔감하여, 거리가 충분히 멀어 차트 품질에 문제가 없고 모서리가 감지될 수 있는 한 확대/축소가 가능합니다. 초점 조절을 통한 측정에 매우 적합하며, 왜곡 측정 또한 매우 정확합니다.

♦는 강력한 지지를 , –는 지지하지 않음을 나타냅니다.

SFRplus – 경사진 모서리의 자동 분석
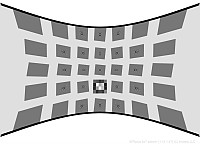
SFRplus 사용법 1부 - SFRplus 차트: 기능 및 사진 촬영 방법
사선 모서리 테스트 - 장점 - 차트 구하기 - 프레임 설정 - 막대 없음 - 조명 - 거리 - 노출 - 팁 - 링크
SFRplus 사용법 2부- SFRplus 실행하기
파일 선택 – 설정 창 – ROI 선택 및 분석 영역 – 에지 ID 파일 – 실행 속도 향상 – 추가 설정 창 – 보조 판독 – 설정 영역 – 감마–차트 대비 비율–자동 모드 창 – 경고 – 클리핑 – 요약
경사 모서리 결과 3부 - SFRplus 모서리 결과
다중 ROI 요약 – 에지 및 MTF – 색수차 – 선명도/SQF – 히스토그램 및 노이즈 – 이미지, 기하, 왜곡, 시야각 – 3D 플롯 – 렌즈 스타일 MTF 플롯 – 에지 거칠기 – 점 확산 함수 – 요약 – CSV 및 JSON 출력
사선 모서리 결과 4부 - SFRplus 기타 결과(톤, 색상, 왜곡 등)
톤 응답 및 감마 - 이미지, 기하학, 왜곡, 시야각 - 방사 왜곡 - 요약 및 EXIF 데이터 - 색상 분석 - 상세 노이즈 플롯 - 요약 - 링크
sfrplus_predistort_200W어안 렌즈용으로 사전 왜곡된 특수 차트 - 자동차 후방 카메라 등 다양한 용도로 사용 가능
SFRplus, eSFR ISO 및 SFRreg 차트가 포함되어 있습니다. 왜곡 전 미리보기를 제공합니다.
SFRplus 왜곡 및 시야각 측정
소개 - 왜곡 보정 전 차트 - SFRplus 및 알고리즘 실행 - 결과 - 왜곡 보정 표시 - 방사형 플롯
SFRplus 또는 eSFR ISO를 사용하여 렌즈를 테스트하는 방법
소개 - 테스트 차트 - 사진 - 조명 - SFRplus 실행 - SFRplus 재분석 - SFRplus 설정 - 자동 실행 옵션 - 표시 옵션 - 보조 판독값 - 결과 해석 - 배치 - 체크리스트 - 링크

eSFRiso_enhanced_200W eSFR ISO – ISO 12233:2014 에지 SFR 차트의 자동 분석

eSFR ISO 사용법 1부- ISO 12233:2014 eSFR 차트: 특징 및 사진 촬영 방법
경사 모서리 테스트 - ISO 12233:2014 준수 - 장점 - 차트 다운로드 - 구도 - 조명 - 거리 - 노출 - 팁 - 관련 링크
eSFR ISO 사용법 2부- eSFR ISO 실행하기
파일 선택 – 설정 창 – ROI 선택 및 분석 영역 – 에지 ID 파일 – 실행 속도 향상 –추가 설정 창 – 보조 판독 – 설정 영역– 감마–차트 대비 비율 – 자동 모드 창 – 경고 – 클리핑 – 요약
Slanted-edge results Part 3 - eSFR ISO edge results
Multi-ROI summary – Edge and MTF – Chromatic Aberration – Acutance/SQF – Histograms & noise – Image, Geometry, Distortion, FoV – 3D Plots – Lens style MTF plot – Edge roughness – Point Spread Function – Summary – CSV & JSON output
Slanted-edge results Part 4 - eSFR ISO other results (tones, color, wedge, etc.)
Tonal response and gamma - Image, Geometry, Distortion, FoV - Radial distortion - Summary and EXIF data - Color analysis - Detailed noise plot - Wedge aliasing & MTF - Multi-wedge plot - Summary - Links
 

SFRreg – Automated analysis of registration mark patterns

Optikos_Meridian_200W
Test at infinity focus with Long Range projection systems

Test imaging systems with ultrawide fisheye lenses (>180 degrees)

Test at very long camera-to-chart distances

Test at variable distances for Depth of Field.

Using SFRreg Part 1 - Registration mark patterns and how to photograph them
target projection - Chart arrays for fisheye lenses - Center Chart - Obtain and photograph chart -  Lighting - Distance - Exposure - Tips - Links
Using SFRreg Part 2 - Running SFRreg
Selecting files – Setup window – ROI selection & analysis area - Speeding up runs - More settings window – Secondary Readout – Settings area – Gamma – Chart contrast ratio – Auto mode window – Warnings - Clipping – Summary
Slanted-edge results Part 3  - SFRreg edge results
Slanted-edge results Part 4 - SFRreg other results (tones, color, distortion, etc.)
 

Checkerboard – Automated analysis of checkerboard patterns

checkerboard_ideal_framing-200WUsing Checkerboard Part 1 - Checkerboard patterns and how to photograph them
Obtain and photograph chart -  Lighting - Distance - Exposure - Tips - Links
Using Checkerboard Part 2 - Running Checkerboard
Selecting files – Setup window – ROI selection & analysis area - Edge ID Files - Speeding up runs - More settings window – Secondary Readout  – Settings area – Gamma – Chart contrast ratio – Auto mode window – Warnings - Clipping – Summary
Slanted-edge results Part 3 - Checkerboard edge results
Slanted-edge results Part 4 - Checkerboard other results (distortion, etc.)

Other (sharpness analyses – Log F-Contrast, Star, Random, Wedge
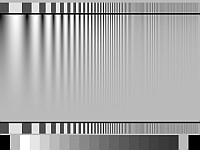
Using Rescharts - Analysis of resolution-related charts
Introduction - Getting started - The Rescharts window - resolution analyses - Slanted-edge SFR - SFRplus - Log frequency (simple) - Log frequency-contrast - Star - Wedge - Random/Dead Leaves - Focus Score
Log Frequency - Analysis of log frequency-varying charts
Introduction - Photographing, running - Color moire - Output - Pattern - MTF - Comparisons - Calculation details - Nyquist, aliasing
Log F-Contrast - Analysis of charts that vary in log frequency and contrast
Introduction - Creating, printing - Photographing, running - Output - Pattern - MTF - MTF/contrast contours - MTFnn
Sharpness and Texture Analysis using Log F‑Contrast from Imaging-Resource – comparing of several different cameras.
Star Chart - Analysis of the Siemens star chart
Introduction - Creating, photographing, running - Output - MTF - MTFnn, MTFnnP - MTF contours - Equations
Random/Dead Leaves - Scale-invariant test charts (including Imatest Spilled Coins)
           for measuring texture sharpness
Introduction - Obtaining - Photographing - running - Automatic ROI detection - Output - MTF - MTFnn, MTFnnP - Power Spectral Density - Equations & Scale-invariance
Texture examples - More details of Imatest Spilled Coins texture sharpness measurements
Images used in Random/Dead Leaves - Spilled Coins vs. Slanted edge MTF
Dead Leaves measurement issue - Illustrates challenges posed by extreme signal processing
Random/Dead Leaves cross method  - Also called the Spilled Coins cross-correlation method.
Wedge Analysis - Analysis of logarithmic, hyperbolic, or trapezoidal wedge patterns with the Wedge and eSFR ISO modules
Introduction - Recommendations - Instructions - Results - Stability - Limitations & Comparisons - Calculation details - MTF/Nyquist & Aliasing - Logarithmic wedges 
Logarithmic wedges - A superior design with the same frequency distribution as Bode of standard frequency response plots.

Sharpness utilities & postprocessors

FocusField - Use batch results from a range of distances (or apertures) to measure Curvature of Field,
          Longitudinal (Axial) Chromatic Aberration, Depth of Field, and lens focal length.
Introduction – Examples – Prepare the test – Range and Increment – Acquire the images – Analyze – Run FocusField - FocusField Settings – Results – Curvature of Field – Depth of Field (DoF) – Longitudinal (Axial) CA – Lens focal length – Stereo (3D) compatibility 
Image Stabilization/Sharpness Compare - SFRplus postprocessor for analyzing (Optical) Image Stabilization
          and comparing sharpness of different images
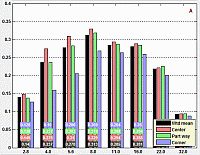
Introduction - Operation - Metrics - Results
Batchview - Postprocessor for viewing summaries of SFR, SFRplus, eSFR ISO, or Checkerboard results
Introduction - Preparation - Instructions
Find Sharpest Files - Find the sharpest files in a batch
Introduction - Operation - Details - Example - Plot 
MTF Compare - Compare MTFs of different cameras and lenses (now used infrequently)
Introduction - Instructions 

Tone, color, and spatial modules

Tone, Color, Noise, and Dynamic Range
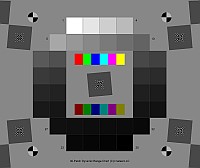
New Imatest Dynamic Range film chart with Dmax = base+3.4Using Color/Tone Interactive – Interactive analysis of color & grayscale test charts
Introduction - Getting started - Supported charts - Reference files - The Color/Tone Setup window - Displays and options
Using Color/Tone Auto (Multitest) - Fixed (batch-capable) analysis of color & grayscale test charts
Introduction - Getting started - Reference files - Results
Color/Tone/eSFR ISO Noise - including chroma, sensor (raw), and visual noise
Chroma noise - Imatest Dynamic range - Image sensor (raw) noise and Dynamic Range - Temporal noise – ISO 15739 & CPIQ Visual Noise – ISO 15739 SNR and Dynamic Range – f-stop noise & scene-referenced SNR 
Image Sensor Noise – measurement and modeling - using raw files for image sensor Dynamic Range and Simatest camera/ISP simulator
Experimental technique - Raw files – Black level offset - Noise model – Dynamic Range – EMVA 1288 – Closing the loop
Color/Tone Test Chart Reference & Guide - A guide to the color & monochrome charts used by Color/Tone.
Chart list – Layout – Numbering – Media/materials – Reference values and files - Color charts - ColorGray-42 - DR36+Color - Monochrome (B&W) charts  
Color/Tone Special Charts (OBSOLETE) - Additional charts, including ISO OECF and noise chats and circles arranged on a square  Instructions - Patch numbering - Examples
Color Correction Matrix (CCM) Calculate a matrix (usually 3x3) for correcting image colors (often from raw images)
Introduction - Math - Calculating in Color/Tone Setup - Saturation - Applying the matrix  1. in Color/Tone  2. in Image Processing  3. externally with program code
Contrast Detection Probability (CDP)  - Based on IEEE p2020 automotive image quality standard
Nonuniformity Correction in grayscale and color chart modules for Color/Tone Auto or Setup, Stepchart, and Colorcheck
Dynamic Range - a general introduction with links to Imatest modules that calculate it.
Contrast Resolution - A special transmissive chart for measuring the visibility of low contrast features in larger fields over a wide dynamic range. Analyzed with Color/Tone Interactive or Auto.
Gamutvision - A module for exploring ICC profiles and gamut mapping — illustrates how colors change when images are moved between files and devices.
Using Gamutvision instructions - Using Gamutvision Part 2: Displays - Gamutvision Table of Contents/Site Map 
Black point compensation demystified - Round trips for evaluating printer profile quality 
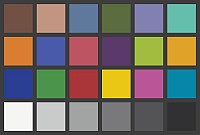
Using Colorcheck (legacy module; not recommended – use Color/Tone instead)
What Colorcheck does - Colorchecker colors - Photographing target - Running Colorcheck - Colorchecker reference sources - Output - Temporal noise - Auto White Balance (AWB) - Saving - Links
Colorcheck/Color/Tone Appendix - Color difference algorithms and reference formulas
Color difference formulas - Color ellipses (Delta-C ab, Delta-C 94, Delta-C 2000, etc.) - Color difference visualizer - Chroma correction (corr) - Algorithm - Grayscale and Exposure error (fix in 5.1+)
Using Stepchart (legacy module; not recommended– use Color/Tone instead)
Photographing the chart - Running Stepchart - Output - Temporal noise - Auto Exposure (AE) - Saving - Dynamic range - Algorithm
Stepchart: Special and ISO charts  Photographing chart - Instructions - Patch order
Dynamic Range (postprocessor) - Calculate Dynamic Range from several Color/Tone Auto or Stepchart images
Introduction - Operation - Results - Dynamic Range background (f-stop/scene-referenced noise)
Measuring test chart patches - with a Spectrophotometer and one of two software packages
Spectrophotometer- Babelcolor Patch Tool - SpectraShop 4 - Patch order

Spatial and Uniformity (Flat field) modules
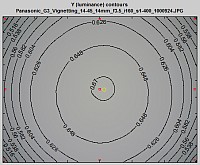
Light Falloff contour plotUsing Flatfield, Part 1 - Measure lens vignetting and image nonuniformity
Instructions - Results
Using Flatfield, Part 2 - Features in Imatest Master and IS (not in Studio)
Input dialog box - Hot and dead pixels - Color shading - Flatfield profiles - Grid plot - Polynomial fit -  Histograms - Noise detail - Spot detection
Using Flatfield-Interactive - Interactive measurement of vignetting and sensor nonuniformity (can be used with direct image acquisition)
Instructions - Results
Using Flatfield Blemish Detect - Measure visible sensor defects
The Human Visual System - Algorithm - Instructions - Input dialog - Results
Flatfield INI Reference
Flatfield statistics - Measure PRNU & DSNU with methods based on EMVA-1288: Separate fixed-pattern (spatial) noise from temporal noise by processing multiple identical images.
Lightbox Comparison Guide - Comparing lightbox brightness and uniformity
Testing flat screen displays - with Imatest Blemish Detect
Testing method - Defective pixels - Luminance nonuniformity - Color nonuniformity - Summary
Dot Pattern - Analysis of a grid of circular dots
Introduction - Setup - Results

Miscellaneous modules and utilities

Lighting Control - Set up and control DMX lights (Kino Flo) and Lightboxes; monitor lighting conditions with an Imatest Spectral Sensor.
Arbitrary Charts - Analyze a chart layout you have designed yourself. 
Introduction - Analyses & Output - INI settings - Chart Definition Files - Chart Definition Utility
Device Manager - Connect to cameras, adjust settings and acquire images into interactive modules.
Video: Dynamic measurements - These can also be performed with direct image acquisition.
Auto White Balance (AWB) - Auto Exposure (AE) - Auto Focus (AF)
Test Charts - Create test charts for high quality inkjet printers
Introduction - Bitmap patterns - SVG patterns - Options
SVG Test Charts - Scalable Vector Graphics charts for MTF and other measurements
Introduction: m x n squares - Squares and wedges - USAF 1951 chart - Operation - Options - Output figure - Printing
Using Screen Patterns - Monitor patterns for Light Falloff, SFR, Distortion, and monitor calibration
Introduction - Light Falloff - SFR - Distortion - Monitor calibration - Monitor gamma - Zone plate - SMPTE color bars - Slanted edges - Colorchecker-Stepchart - Squares (checkerboard)
Rename Files - using EXIF data
Starting - 1. Select folder - 2. Select files - 3. Rename options - 4. Preview - 5. Rename files
Image Processing - Simulate several image processing operations (degradations: blur and noise; enhancements: sharpen, bilateral filter, tone mapping, etc.) and observe their effects on appearance and measurements (MTF, SSIM, etc.).
Operation - Image processing blocks - Displays and analysis - Optical Character Recognition (OCR) - Face and People Detection
Image Statistics - Interactively observe image statistics: cross sections, means, noise, SNR, histograms, and frequency spectra.
Database - Collect and store important information on image capture conditions, device state, and EXIF metadata
Composite Chart - Create a synthetic test chart from several individual image files. Can be used for Photon Transfer Curves.
Educational Apps - Learning resource for image quality factors and measurements. 

Imatest IT – Industrial Testing (non-GUI)

Managing Supply Chain Image Quality with Imatest
Imatest IT Test Items & Modules
Imatest IT-EXE instructions - Running Imatest IT (Industrial Testing)-EXE
Introduction - Installation - Step 1: Capture Images - Step 2: Configure INI File - Step 3: Call Imatest IT Modules - Step 4: Process Results - Error Handling - Sample Code - Advanced Topics - Troubleshooting
Imatest IT-C instructions - Running Imatest IT (Industrial Testing)-C
Introduction - Installation - Step 1: Capture Images - Step 2: Configure INI File - Step 3: Call Imatest IT Modules - Step 4: Process Results - Error Handling - Sample Code - Advanced Topics - Troubleshooting
Imatest IT-C++ instructions - Running Imatest IT (Industrial Testing)-C++
Introduction - Installation - Step 1: Capture Images - Step 2: Configure INI File - Step 3: Call Imatest IT Modules - Step 4: Process Results - Error Handling - Sample Code - Advanced Topics - Troubleshooting
Imatest IT-Python instructions - Running Imatest IT (Industrial Testing)-Python
Introduction - Installation - Step 1: Capture Images - Step 2: Configure INI File - Step 3: Call Imatest IT Modules - Step 4: Process Results - Error Handling - Sample Code - Advanced Topics - Troubleshooting
Imatest IT-.NET (C#) instructions - Running Imatest IT (Industrial Testing)-.NET (C#)
Introduction - Installation - Step 1: Capture Images - Step 2: Configure INI File - Step 3: Call Imatest IT Modules - Step 4: Process Results - Error Handling - Sample Code - Advanced Topics - Troubleshooting
Imatest IT-.NET (Visual Basic) instructions - Running Imatest IT (Industrial Testing)-.NET (Visual Basic)
Introduction - Installation - Step 1: Capture Images - Step 2: Configure INI File - Step 3: Call Imatest IT Modules - Step 4: Process Results - Error Handling - Sample Code - Advanced Topics - Troubleshooting
Imatest IT Parallel (IT-P) - Accelerating Imatest IT by performing tests in parallel
Imatest INI file reference - Reference to INI files for IT/EXE and IT/DLL users (sections used in several modules)
INI file structure - INI File Monitor - [api] (for Imatest IT) - [dcraw/LibRaw] - [rdraw] (Generalized Read Raw) - Secondary Readouts - Miscellaneous
SFR INI file reference | SFRplus INI file reference | eSFR ISO INI file reference | SFRreg INI file reference | Checkerboard INI file reference
Direct Read Mode - Pass image data directly into Imatest IT, without writing to a file on disk
Implementing Pass/Fail - Setting up Pass/Fail criteria and Pass/Fail Reference. For Imatest IT and GUI versions.
Pass/Fail Monitor - Realtime display and update of pass/fail results (useful with Imatest IT)
Operator Console - User interface for production environments
Imatest IT Knowledge Base - Articles about Imatest IT

Appendix

FAQ - Frequently Asked Questions
Cross-reference tables - Tables to help you navigate Imatest
Suppliers - Image quality factors - Modules - Test charts - Test images
Version comparison: Studio vs. Master - Which is right for you?
Troubleshooting - What to do when Imatest doesn't work
Installation problems - Problems after install - Missing DLLs - Runtime problems - Corrupted INI file - Command (DOS) window - A module has stopped working - Diagnostics runs - Path conflicts
Imatest Change Log - Imatest release history
Default INI Folder - Location on your computer of resource files used by Imatest
INI file reference
License - The Imatest End User License Agreement (EULA)
Glosario en Espanol

Index of the Table of Contents
Image quality — Sharpness — Other IQ factors — IQ Utilities —  Getting started — Imatest Instructions – general — 

Troubleshooting —  Knowledge Base highlights — Slanted-Edge sharpness modules — Other sharpness modules —
Tone, Color, Noise & Dynamic Range modules — Spatial & Uniformity modules —
Miscellaneous modules and utilities
— Industrial Testing edition — Appendix