文档 - 当前版本 v26.1

目录索引
图像质量 
Imatest 测量的 IQ 因素(KPI),并附有详细说明和说明的链接。
清晰度清晰度和锐化简介;不同图表的比较;图表质量的局限性及克服方法
其他智商因素 噪声、信噪比、时间噪声、动态范围 (DR)、色差、失真、眩光、香农信息容量和图像信息指标等。
入门为什么选择 Imatest?测试图表、照明、图像采集技术、实验室搭建、Imatest 软件使用
开始使用 Imatest 软件安装、使用 Imatest、图像文件格式和设备、激活/停用
一般说明特殊标准、支持的设备、测试管理器、原始文件、测试实验室、INI 文件、通过/失败监视器
输出文档选定的 JSON、CSV 和 XML 输出的描述
获取图像用于获取图像的文件、格式、设备和实用程序
知识库亮点提供故障排除、激活和一般操作建议的文章链接。
故障排除当 Imatest 没有按预期工作时该怎么办
Simatest 相机/ISP 模拟器 Simatest – 图像信号处理/相机模拟器 – 示例 – 图像传感器噪声
IQ Utilities SSIM、图像统计、径向几何
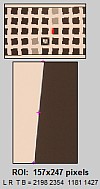
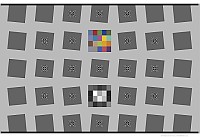
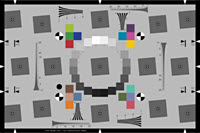
斜边锐化模块SFR (手动 ROI)、 SFRplus 、 eSFR ISO 、 SFRreg 、棋盘格(自动 ROI 检测)
本文对四种自动检测斜边锐化模块进行了比较。
其他锐化模块Log F-对比度、星形、随机/枯叶/散落硬币、楔形、锐化工具和后期处理器
锐化工具和后处理器MTF比较、图像稳定、批量视图、查找ShGarpest文件
色调、色彩、噪声和动态范围模块颜色/色调(交互式和自动)、CCM(颜色校正矩阵)、CDP、对比度分辨率、颜色检查、阶梯图、测量色块、用于评估 ICC 颜色配置文件和色域映射的Gamutvision 。
空间与平面模块平面场、平面场交互式、失真、点阵图案、测试显示器
杂项模块和实用程序照明控制、任意图表、设备管理器、自动白平衡/曝光/对焦 (AWB、AE、AF)、打印和显示测试图表、重命名文件、教育应用、数据库
工业测试版模块、各种接口(EXE、C、C++、Python、.NET)的指令、INI 文件参考、通过/失败判定、操作员控制台、加速
附录常见问题解答、版本说明、故障排除、变更日志、INI 文件参考、许可证

图像质量

概述 — 图像质量因素简介(关键绩效指标 – KPI)

图像质量因素– 概述和 Imatest 测量建议,适合入门。

引言-汇总表-图像质量因素-锐度-纹理-噪点-信息容量和指标-色调响应-动态范围-色彩准确度-失真-均匀性-瑕疵-曝光准确度/ISO感光度 -横向色差-杂散光(眩光) -天花板眩光-彩色摩尔纹-软件伪影-数据压缩- 打印机质量因素

清晰度
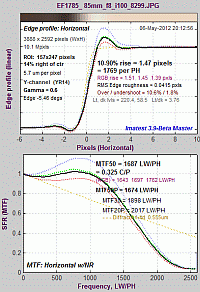
清晰度 —— 它是什么?如何测量?
清晰度——它是什么?如何测量?

简介- MTF - MTF 方程-空间频率单位-汇总指标-MTF 测量矩阵 - 测量技术比较 -斜边测量-为什么需要斜边? -削波-降噪-MTF50 的解读-自动对焦 (AF) 速度-计算细节-斜边算法-Imatest 与 ISO 计算-链接

锐化 ——以及用于比较相机的标准化锐化

简介-示例-过锐化/欠锐化-示例- USM(USM锐化) -相关链接- 标准化锐化

比较不同相机的清晰度 ——应用方式:“以图像为中心”(用于图像)或“以物体为中心”(用于医疗、机器视觉等)会极大地影响图像的比较方式。

验证 Imatest 斜边计算

斜边式与西门子星形式——信号处理灵敏度比较

引言-图像-原始结果-斜边处理结果-正弦波(对数F对比度和西门子星形)处理结果-极限锐化-总结-结论

斜边式与西门子星形式对比,第二部分——四台额外摄像机的测试结果

斜边与西门子星形 MTF 计算:2024 年白皮书

斜边测量的一致性和重复性 ——比较不同的ISO感光度和ROI尺寸。虽然不完整,但仍然有用。

奈奎斯特频率、混叠和彩色莫尔条纹 ——引入一种从楔形导出的彩色混叠度量。

衍射、最佳光圈和散焦-镜头像差-衍射-像素响应极限和Q值-散焦 

显示(监视器)清晰度- 显示图表-捕获图像-分析-结果-电视线-监视器伽玛- CMS 系统

摄像头监控系统(CMS) ——用于汽车后视镜更换系统和某些内窥镜

倾斜边缘 MTF 测量的 LSF(线扩散函数)校正因子

校正倾斜边缘MTF测量中垂直于边缘的非均匀照明

补偿相机 MTF 测量值,使其与图表和传感器 MTF 相符

简介-计算- MTF补偿文件-应用补偿-用于测量镜头MTF的传感器MTF补偿- MTF测量图表

色卡质量计算器 - 基于特定介质和打印方法的 MTF 测量值,确定色卡是否适用于特定应用。学习起来略微复杂。我们建议您参考下方的“测试色卡适用性”部分。
MTF测量适用性测试图表 - 用于确定多种介质类型(喷墨和照相;反射式和透射式)MTF测量适用性的图表。基于图表质量计算器结果。
隐含清晰度假设(衍射) -图表适用性显示-喷墨哑光纸-黑白相纸-彩色 LVT |黑白 LVT - MTF 适用性计算 
反射图表质量比较:喷墨打印 vs. 照片打印
透射图表质量比较
MTF曲线和图像外观——测量与外观的相关性
引言-斜边测试-参考图像-锐化图像-模糊图像-锐化+模糊图像-观察结果-锐度排名-链接
锐度和主观质量因子 (SQF) :感知清晰度测量
引言-锐度和MTF -锐度和SQF的含义-锐度和SQF的测量- SQF方程式- CSF -链接
 

其他图像质量因素

伽玛值、色调响应及相关概念——其用途、测量方法等等
引言– 编码伽马与显示伽马– 为什么使用对数? – 伽马编码如何提升动态范围– 预期伽马值– 伽马与调制传递函数 (MTF) – 计算伽马时使用哪些色块? – 为什么伽马值约为 2.2? – 色调映射– 对比度:比率、韦伯对比度、 米歇尔森对比度– 对数色彩空间– 显示器伽马
摄影图像中的噪声 
引言-非均匀性校正-测量-信噪比(带宽) -外观-总结-光圈噪声、场景参考信噪比和动态范围-时间噪声- ISO 15739 -噪声的数学原理-原始噪声与去马赛克噪声-频谱-链接
时间噪声 ——比较双图像和多图像测量
动态范围 - 概述,并提供指向 Imatest 计算动态范围的模块的链接。
传感器动态范围与系统动态范围– 眩光、图表、曝光– 动态范围定义– 透射式图表– 灯箱– 如何测量动态范围– 减少反射– 对比度分辨率图表–技巧和建议– 偏移–更多关于眩光的内容 – 眩光– 动态范围受限– 光圈噪声和场景参考信噪比
色差 (横向色差)又称彩色条纹
引言-测量-去马赛克-非切向边缘校正-紫边
失真 - 方法和模块   失真公式-模块-电视失真和视场角-结果比较
三个光学中心——清晰度中心、照明中心和畸变中心

杂散光(炫光)

简介-输出-示例-原因-测试概述-测试因素-主控和 IT 指令-归一化杂散光指令-设置-计算-归一化方法- 光源掩模方法 
薄纱般的眩光
引言-目标-阶梯图测量-结果- ISO 9358 - ISO 18844 均匀性测量-对比度分辨率双曝光法
色彩校正矩阵
简介-数学-颜色/色调交互-饱和度-应用矩阵
ISO感光度和曝光指数
简介–入射光测量–模块–公式–原始文件–基于饱和度–标准输出–相关文档
信息容量新闻、视频和链接都在 “解决方案 - 图像信息指标”上。

EI2024论文《 倾斜边缘的图像信息度量》是对这些新度量的极佳介绍。

两份 2023-2024 年白皮书包含了最新的信息容量测量和结果,包括边缘信噪比和滤波器设计。

《图像信息度量导论》是对图像信息容量及相关度量的最简洁的介绍,公式和技术细节极少。

Imatest 中的图像信息度量是对图像信息容量及相关度量的中级介绍。

图像信息度量及其应用:参考 (共41页)包含了所有公式和技术细节,是篇幅较短文档的参考资料。

西门子星形方法于 2020 年推出,速度较慢,但更适合观察图像处理伪影(去马赛克、数据压缩等)的影响。
 
基于信息的动态范围-第一部分:引言-第二部分:InfoDR 的应用-第三部分:结果
西门子星(2020)的香农信息容量——一个结合了清晰度和噪声的评价指标。
含义-结果-总结
从倾斜边缘测量信息容量:方程和算法(2023-4)- 结合清晰度和噪声的品质因数,可方便地从任何倾斜边缘测量,包括 NPS、NEQ 和 SNRi。
从倾斜边缘测量信息容量:说明(2023-4) - 关于新计算的说明。

图像质量测试入门

为什么选择 Imatest? |测试图表|照明|图像采集技术|实验室搭建|使用 Imatest 软件 
来自 Github 的几个模块的示例图片

开始使用 Imatest 软件

安装和入门
安装-购买-注册-离线注册-文件
使用 Imatest - 入门- 简介和一般说明推荐给初学者。
Imatest 工作流程–选择图表和模块–运行 Imatest –查找 Imatest 帮助– Imatest 主窗口–窗口和字体大小–三个实用按钮–原始文件–其他控件和实用程序– EXIF 显示– ROI 选项–选项 II – EXIF 数据设置–下拉菜单–图形– CSV 和 JSON 输出–许可–成功测试技巧
基于信息指标的图像质量测试
图像文件格式和采集设备- Imatest 的多种图像源 -如果图像文件读取失败该怎么办
标准(可互换)图像文件- YUV 及其他格式-原始文件-视频文件-用于 Imatest 的采集设备
Imatest Image Master 支持的图像采集硬件
固定模块与交互式模块
激活/停用- 激活Imatest并将其从一台计算机移动到另一台计算机。
在线激活|离线激活|在线停用|离线停用|浮动许可证|代理服务器
知识库——包含多个链接,可帮助解决激活问题。

Imatest 使用说明 – 一般说明

会话日志记录-显示和日志文件的日志级别控制
目标检测设置-用于在默认检测失败时指导自动目标检测的设置。
棋盘格- SFRreg
Skype视频规格支持 -说明和建议
IEEE CPIQ(手机相机图像质量)支持
SFR 和锐度-色彩均匀性-失真和色差-纹理
搭建测试实验室——如何搭建测试实验室
简介- 硬件- 搭建低成本测试实验室-画架- 光线测量-三脚架-夹具- 组装- 目标物- 目标物与相机的对准 
保存和检索感兴趣区域 (ROI) - 如何将 ROI 保存到命名文件中以供将来使用。
已保存的设置 - Imatest-v2.ini 和 INI 文件,用于 Imatest IT
imatest-v2.ini - INI 文件实用程序- INI 文件编辑器-创建自定义图标-锁定设置 
通过/失败监控器 - 实时显示和更新通过/失败结果(与Imatest IT配合使用很有用)
简介-设置-实用程序

输出文档

锐度和失真模块的嵌入式输出文档
输出文档 Google 表格
输出文档 Excel 表格
杂散光和同心环的结果

获取图像 - 文件、格式、设备和工具

设备管理器-连接摄像头,调整设置并将图像采集到交互式模块中。
Imatest Image Master 支持的图像采集硬件
使用直接图像采集——直接从设备采集图像
ON Semi Devware 快速入门指南,用于直接图像采集
Omnivision 快速入门指南,用于直接图像采集
用于直接图像采集的 Android 相机接口
用于直接图像采集的 Sony AYA 接口
On Semi DevWareX 接口用于直接图像采集
测试经理
自动批处理- 将单个设备的多个测试映像(来自不同模块)合并到自动批处理运行中。
Imatest 功能界面——一个简化的界面,用于以一致的设置运行测试
功能界面-编辑器-使用 INI 编辑器准备合并文件(未来版本中可能弃用)
原始文件- Imatest模块可以直接分析原始文件,也可以在去马赛克后分析原始文件。
简介-使用原始文件- Bayer 原始文件和 RCCC 文件- LibRaw 去马赛克(适用于商业原始文件) - Bayer 频率单元- DNG 文件- Rawview 工具-通用读取原始文件(适用于二进制原始文件) -解压缩-创建合成原始图像
 

知识库亮点 - 提供故障排除、激活和一般操作建议的文章链接。

之前运行正常的模块现在停止工作了。
如何存储和检索区域(ROI)选择
2019 年 Imatest 新版许可 – 需要更新才能激活
完整的知识库中还有更多类似的链接。
 
故障排除 - Imatest 无法正常工作时该怎么办
崩溃报告 - 首先执行此操作-安装问题- 3.6 及更高版本变更-安装后问题-缺少 DLL文件 -运行时问题- INI 文件损坏-模块停止工作-错误报告-命令 (DOS) 窗口-诊断运行- 路径冲突

Simatest ISP/摄像头模拟器

Simatest:概述 - Simatest 相机/图像信号处理 (ISP) 模拟器简介:展示图像传感器噪声和最常见的 ISP 模块如何影响图像外观和测量结果。将于 2025 年 2 月起在Simatest Pilot 项目中提供。
引言– 框图– 输入文件–运行 Simatest – 设置– 图像处理模块–结果– 并排视图– Simatest 的优势– 低光照分析– 附录:图像传感器噪声模型
Simatest:说明和参考- Simatest ISP/摄像头仿真完整参考 
输入文件–打开 Simatest –设置–图像处理模块–锐化–图像传感器噪声–运行 Simatest –处理–并排视图–结果–控制– OCR –人脸和人物检测
Simatest 示例- 使用 Simatest 测量图像传感器噪声以及模拟相机和 ISP 性能的示例
Simatest框图– 图像传感器噪声建模– 噪声测量–噪声模拟– 图像清晰度建模与测量–图像清晰度模拟– 相机JPEG图像模拟
图像传感器噪声——测量与建模——使用原始文件测量Simatest的动态范围和噪声
图像处理(旧模块 - 已被 Simatest 取代) - 模拟图像处理操作(降级和增强),并观察其对外观和测量结果的影响 -操作-图像处理模块-显示和分析- OCR -人脸和行人检测

图像质量工具可以降低、增强、检查或分析任何图像(不仅限于测试图表)。

SSIM:结构相似性指数 ——衡量图像质量下降以及信号处理(例如压缩)造成的伪影。此外,还衡量峰值信噪比(PSNR)。
操作-选项
图像统计 - 交互式观察图像统计信息:横截面、均值、噪声、信噪比、直方图和频谱。
径向几何 - 为图像添加或校正失真、横向色差或旋转。

斜边锐化模块

SFR – 倾斜边缘的基本分析(手动选择 ROI)

使用SFR(第1部分) ——设置和拍摄SFR靶标
斜边测试-打印图表-照明-距离-曝光-技巧-质量和距离
使用 SFR 第 2 部分 - 运行 Imatest SFR
图像文件- ROI(感兴趣区域) -裁剪建议(ROI 大小) -其他输入-辅助读数-公式- Gamma 值-警告-保存-重复运行- Excel CSV 输出
Imatest SFR LCD 靶
屏幕图案模块-网页图案
SFR 结果:MTF(清晰度)图
SFR结果: - 色差、噪声和香农容量图
SFR结果:多个感兴趣区域(ROI)图
二维汇总图-一维汇总图- CSV 输出文件-汇总说明- Excel 图表

SFR 结果:自动对焦 (AF) 图


具有自动区域检测功能的斜边MTF模块表(交互式或自动(批量)分析)
所有产品均支持符合 ISO 标准的MTF(清晰度)分析、横向色差 (LCA)分析,以及 2:1 至 10:1 图表对比度的信息容量,其中 ISO 标准 4:1 为首选。
特征SFRplus
eSFR ISO
eSFRiso_enhanced_200W
SFRreg
Optikos_Meridian_200W
棋盘
棋盘格理想框架-200W
清晰度图细节高的中等的取决于具体安排。高的
ISO标准图表设计 – ♦ – –
颜色分析♦ ♦ (仅适用于SFRreg中心图表) –
音调反应(OECF) ♦ ♦ (仅适用于SFRreg中心图表) –
噪声分析有限的♦有限的有限的
失真♦ 好有限的– ♦最佳
几何(旋转,
视野、梯形校正等)
♦ ♦ – ♦
特点和
推荐用途
Imatest 原创的自动检测图表,自 2009 年起投入使用。功能强大且用途广泛。建议在顶部和底部标尺上方留出一些空白。与 eSFR ISO 相比,它能提供更丰富的空间细节和畸变信息。
符合 ISO 标准的图表设计。包含楔形分析和(可选)色块分析。支持详细的噪声分析。

图像区域周围通常会放置多个单独的图表。
- 极端鱼眼镜头 (>180°)
- 目标投影系统
- 在不同距离拍摄照片,以测试对焦和景深。
- 超高分辨率摄像头(>36MP)

对取景相对不敏感:只要距离足够远,图表质量不受影响且边角清晰可见,就可以放大或缩小图像。非常适合用于对焦测量。畸变测量精度很高。

♦ 表示强烈支持; – 表示不支持。

SFRplus – 倾斜边缘的自动分析
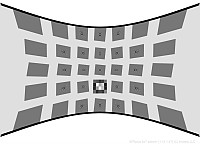
SFRplus 使用指南(第一部分) ——SFRplus 图表:功能介绍及拍摄方法
斜边测试-优点-获取图表-构图-无横条-照明-距离-曝光-技巧-链接
使用 SFRplus 第 2 部分- 运行 SFRplus
文件选择–设置窗口– ROI 选择和分析区域–边缘 ID 文件–加速运行–更多设置窗口–辅助读数–设置区域– Gamma–图表对比度–自动模式窗口–警告 – 裁剪–摘要
斜边结果 第 3 部分- SFRplus 边缘结果
多 ROI 汇总–边缘和 MTF –色差–锐度/SQF –直方图和噪声–图像、几何形状、畸变、视场角– 3D 图–镜头风格 MTF 图–边缘粗糙度–点扩散函数–汇总– CSV 和 JSON 输出
斜边测试结果 第 4 部分- SFRplus 其他结果(色调、色彩、失真等)
色调响应和伽玛-图像、几何形状、失真、视场角-径向失真-总结和 EXIF 数据-颜色分析-详细噪声图-总结-链接
sfrplus_predistort_200W适用于鱼眼镜头的预失真和特殊图表 ——广泛应用于汽车后视摄像头等多种应用场景。
包含 SFRplus、eSFR ISO 和 SFRreg 图表。预览预失真。
SFRplus畸变和视场测量
简介-预失真图表-运行 SFRplus 和算法-结果-失真校正显示-径向图
如何使用 SFRplus 或 eSFR ISO 测试镜头
简介-测试图表-照片-照明-运行 SFRplus - SFRplus 图表- SFRplus 设置-自动运行选项-显示选项-辅助读数-结果解读-批次-检查清单-链接

eSFRiso_enhanced_200W eSFR ISO – ISO 12233:2014边缘 SFR 图表的自动分析

使用 eSFR ISO 第 1 部分- ISO 12233:2014 E-SFR 图表:特性及拍摄方法
斜边测试-符合 ISO 12233:2014 标准-优势-获取图表-构图-照明-距离-曝光-技巧-链接
使用 eSFR ISO 第 2 部分- 运行 eSFR ISO
文件选择–设置窗口– ROI 选择和分析区域–边缘 ID 文件–加速运行–更多设置窗口–辅助读数–设置区域– Gamma–图表对比度–自动模式窗口–警告 – 裁剪–摘要
Slanted-edge results Part 3 - eSFR ISO edge results
Multi-ROI summary – Edge and MTF – Chromatic Aberration – Acutance/SQF – Histograms & noise – Image, Geometry, Distortion, FoV – 3D Plots – Lens style MTF plot – Edge roughness – Point Spread Function – Summary – CSV & JSON output
Slanted-edge results Part 4 - eSFR ISO other results (tones, color, wedge, etc.)
Tonal response and gamma - Image, Geometry, Distortion, FoV - Radial distortion - Summary and EXIF data - Color analysis - Detailed noise plot - Wedge aliasing & MTF - Multi-wedge plot - Summary - Links
 

SFRreg – Automated analysis of registration mark patterns

Optikos_Meridian_200W
Test at infinity focus with Long Range projection systems

Test imaging systems with ultrawide fisheye lenses (>180 degrees)

Test at very long camera-to-chart distances

Test at variable distances for Depth of Field.

Using SFRreg Part 1 - Registration mark patterns and how to photograph them
target projection - Chart arrays for fisheye lenses - Center Chart - Obtain and photograph chart -  Lighting - Distance - Exposure - Tips - Links
Using SFRreg Part 2 - Running SFRreg
Selecting files – Setup window – ROI selection & analysis area - Speeding up runs - More settings window – Secondary Readout – Settings area – Gamma – Chart contrast ratio – Auto mode window – Warnings - Clipping – Summary
Slanted-edge results Part 3  - SFRreg edge results
Slanted-edge results Part 4 - SFRreg other results (tones, color, distortion, etc.)
 

Checkerboard – Automated analysis of checkerboard patterns

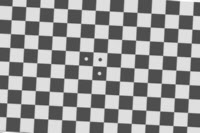
checkerboard_ideal_framing-200WUsing Checkerboard Part 1 - Checkerboard patterns and how to photograph them
Obtain and photograph chart -  Lighting - Distance - Exposure - Tips - Links
Using Checkerboard Part 2 - Running Checkerboard
Selecting files – Setup window – ROI selection & analysis area - Edge ID Files - Speeding up runs - More settings window – Secondary Readout  – Settings area – Gamma – Chart contrast ratio – Auto mode window – Warnings - Clipping – Summary
Slanted-edge results Part 3 - Checkerboard edge results
Slanted-edge results Part 4 - Checkerboard other results (distortion, etc.)

Other (sharpness analyses – Log F-Contrast, Star, Random, Wedge
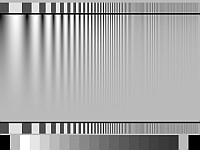
Using Rescharts - Analysis of resolution-related charts
Introduction - Getting started - The Rescharts window - resolution analyses - Slanted-edge SFR - SFRplus - Log frequency (simple) - Log frequency-contrast - Star - Wedge - Random/Dead Leaves - Focus Score
Log Frequency - Analysis of log frequency-varying charts
Introduction - Photographing, running - Color moire - Output - Pattern - MTF - Comparisons - Calculation details - Nyquist, aliasing
Log F-Contrast - Analysis of charts that vary in log frequency and contrast
Introduction - Creating, printing - Photographing, running - Output - Pattern - MTF - MTF/contrast contours - MTFnn
Sharpness and Texture Analysis using Log F‑Contrast from Imaging-Resource – comparing of several different cameras.
Star Chart - Analysis of the Siemens star chart
Introduction - Creating, photographing, running - Output - MTF - MTFnn, MTFnnP - MTF contours - Equations
Random/Dead Leaves - Scale-invariant test charts (including Imatest Spilled Coins)
           for measuring texture sharpness
Introduction - Obtaining - Photographing - running - Automatic ROI detection - Output - MTF - MTFnn, MTFnnP - Power Spectral Density - Equations & Scale-invariance
Texture examples - More details of Imatest Spilled Coins texture sharpness measurements
Images used in Random/Dead Leaves - Spilled Coins vs. Slanted edge MTF
Dead Leaves measurement issue - Illustrates challenges posed by extreme signal processing
Random/Dead Leaves cross method  - Also called the Spilled Coins cross-correlation method.
Wedge Analysis - Analysis of logarithmic, hyperbolic, or trapezoidal wedge patterns with the Wedge and eSFR ISO modules
Introduction - Recommendations - Instructions - Results - Stability - Limitations & Comparisons - Calculation details - MTF/Nyquist & Aliasing - Logarithmic wedges 
Logarithmic wedges - A superior design with the same frequency distribution as Bode of standard frequency response plots.

Sharpness utilities & postprocessors

FocusField - Use batch results from a range of distances (or apertures) to measure Curvature of Field,
          Longitudinal (Axial) Chromatic Aberration, Depth of Field, and lens focal length.
Introduction – Examples – Prepare the test – Range and Increment – Acquire the images – Analyze – Run FocusField - FocusField Settings – Results – Curvature of Field – Depth of Field (DoF) – Longitudinal (Axial) CA – Lens focal length – Stereo (3D) compatibility 
Image Stabilization/Sharpness Compare - SFRplus postprocessor for analyzing (Optical) Image Stabilization
          and comparing sharpness of different images
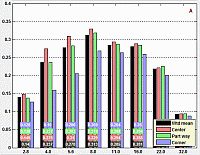
Introduction - Operation - Metrics - Results
Batchview - Postprocessor for viewing summaries of SFR, SFRplus, eSFR ISO, or Checkerboard results
Introduction - Preparation - Instructions
Find Sharpest Files - Find the sharpest files in a batch
Introduction - Operation - Details - Example - Plot 
MTF Compare - Compare MTFs of different cameras and lenses (now used infrequently)
Introduction - Instructions 

Tone, color, and spatial modules

Tone, Color, Noise, and Dynamic Range
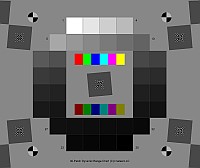
New Imatest Dynamic Range film chart with Dmax = base+3.4Using Color/Tone Interactive – Interactive analysis of color & grayscale test charts
Introduction - Getting started - Supported charts - Reference files - The Color/Tone Setup window - Displays and options
Using Color/Tone Auto (Multitest) - Fixed (batch-capable) analysis of color & grayscale test charts
Introduction - Getting started - Reference files - Results
Color/Tone/eSFR ISO Noise - including chroma, sensor (raw), and visual noise
Chroma noise - Imatest Dynamic range - Image sensor (raw) noise and Dynamic Range - Temporal noise – ISO 15739 & CPIQ Visual Noise – ISO 15739 SNR and Dynamic Range – f-stop noise & scene-referenced SNR 
Image Sensor Noise – measurement and modeling - using raw files for image sensor Dynamic Range and Simatest camera/ISP simulator
Experimental technique - Raw files – Black level offset - Noise model – Dynamic Range – EMVA 1288 – Closing the loop
Color/Tone Test Chart Reference & Guide - A guide to the color & monochrome charts used by Color/Tone.
Chart list – Layout – Numbering – Media/materials – Reference values and files - Color charts - ColorGray-42 - DR36+Color - Monochrome (B&W) charts  
Color/Tone Special Charts (OBSOLETE) - Additional charts, including ISO OECF and noise chats and circles arranged on a square  Instructions - Patch numbering - Examples
Color Correction Matrix (CCM) Calculate a matrix (usually 3x3) for correcting image colors (often from raw images)
Introduction - Math - Calculating in Color/Tone Setup - Saturation - Applying the matrix  1. in Color/Tone  2. in Image Processing  3. externally with program code
Contrast Detection Probability (CDP)  - Based on IEEE p2020 automotive image quality standard
Nonuniformity Correction in grayscale and color chart modules for Color/Tone Auto or Setup, Stepchart, and Colorcheck
Dynamic Range - a general introduction with links to Imatest modules that calculate it.
Contrast Resolution - A special transmissive chart for measuring the visibility of low contrast features in larger fields over a wide dynamic range. Analyzed with Color/Tone Interactive or Auto.
Gamutvision - A module for exploring ICC profiles and gamut mapping — illustrates how colors change when images are moved between files and devices.
Using Gamutvision instructions - Using Gamutvision Part 2: Displays - Gamutvision Table of Contents/Site Map 
Black point compensation demystified - Round trips for evaluating printer profile quality 
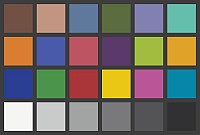
Using Colorcheck (legacy module; not recommended – use Color/Tone instead)
What Colorcheck does - Colorchecker colors - Photographing target - Running Colorcheck - Colorchecker reference sources - Output - Temporal noise - Auto White Balance (AWB) - Saving - Links
Colorcheck/Color/Tone Appendix - Color difference algorithms and reference formulas
Color difference formulas - Color ellipses (Delta-C ab, Delta-C 94, Delta-C 2000, etc.) - Color difference visualizer - Chroma correction (corr) - Algorithm - Grayscale and Exposure error (fix in 5.1+)
Using Stepchart (legacy module; not recommended– use Color/Tone instead)
Photographing the chart - Running Stepchart - Output - Temporal noise - Auto Exposure (AE) - Saving - Dynamic range - Algorithm
Stepchart: Special and ISO charts  Photographing chart - Instructions - Patch order
Dynamic Range (postprocessor) - Calculate Dynamic Range from several Color/Tone Auto or Stepchart images
Introduction - Operation - Results - Dynamic Range background (f-stop/scene-referenced noise)
Measuring test chart patches - with a Spectrophotometer and one of two software packages
Spectrophotometer- Babelcolor Patch Tool - SpectraShop 4 - Patch order

Spatial and Uniformity (Flat field) modules
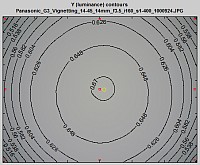
Light Falloff contour plotUsing Flatfield, Part 1 - Measure lens vignetting and image nonuniformity
Instructions - Results
Using Flatfield, Part 2 - Features in Imatest Master and IS (not in Studio)
Input dialog box - Hot and dead pixels - Color shading - Flatfield profiles - Grid plot - Polynomial fit -  Histograms - Noise detail - Spot detection
Using Flatfield-Interactive - Interactive measurement of vignetting and sensor nonuniformity (can be used with direct image acquisition)
Instructions - Results
Using Flatfield Blemish Detect - Measure visible sensor defects
The Human Visual System - Algorithm - Instructions - Input dialog - Results
Flatfield INI Reference
Flatfield statistics - Measure PRNU & DSNU with methods based on EMVA-1288: Separate fixed-pattern (spatial) noise from temporal noise by processing multiple identical images.
Lightbox Comparison Guide - Comparing lightbox brightness and uniformity
Testing flat screen displays - with Imatest Blemish Detect
Testing method - Defective pixels - Luminance nonuniformity - Color nonuniformity - Summary
Dot Pattern - Analysis of a grid of circular dots
Introduction - Setup - Results

Miscellaneous modules and utilities

Lighting Control - Set up and control DMX lights (Kino Flo) and Lightboxes; monitor lighting conditions with an Imatest Spectral Sensor.
Arbitrary Charts - Analyze a chart layout you have designed yourself. 
Introduction - Analyses & Output - INI settings - Chart Definition Files - Chart Definition Utility
Device Manager - Connect to cameras, adjust settings and acquire images into interactive modules.
Video: Dynamic measurements - These can also be performed with direct image acquisition.
Auto White Balance (AWB) - Auto Exposure (AE) - Auto Focus (AF)
Test Charts - Create test charts for high quality inkjet printers
Introduction - Bitmap patterns - SVG patterns - Options
SVG Test Charts - Scalable Vector Graphics charts for MTF and other measurements
Introduction: m x n squares - Squares and wedges - USAF 1951 chart - Operation - Options - Output figure - Printing
Using Screen Patterns - Monitor patterns for Light Falloff, SFR, Distortion, and monitor calibration
Introduction - Light Falloff - SFR - Distortion - Monitor calibration - Monitor gamma - Zone plate - SMPTE color bars - Slanted edges - Colorchecker-Stepchart - Squares (checkerboard)
Rename Files - using EXIF data
Starting - 1. Select folder - 2. Select files - 3. Rename options - 4. Preview - 5. Rename files
Image Processing - Simulate several image processing operations (degradations: blur and noise; enhancements: sharpen, bilateral filter, tone mapping, etc.) and observe their effects on appearance and measurements (MTF, SSIM, etc.).
Operation - Image processing blocks - Displays and analysis - Optical Character Recognition (OCR) - Face and People Detection
Image Statistics - Interactively observe image statistics: cross sections, means, noise, SNR, histograms, and frequency spectra.
Database - Collect and store important information on image capture conditions, device state, and EXIF metadata
Composite Chart - Create a synthetic test chart from several individual image files. Can be used for Photon Transfer Curves.
Educational Apps - Learning resource for image quality factors and measurements. 

Imatest IT – Industrial Testing (non-GUI)

Managing Supply Chain Image Quality with Imatest
Imatest IT Test Items & Modules
Imatest IT-EXE instructions - Running Imatest IT (Industrial Testing)-EXE
Introduction - Installation - Step 1: Capture Images - Step 2: Configure INI File - Step 3: Call Imatest IT Modules - Step 4: Process Results - Error Handling - Sample Code - Advanced Topics - Troubleshooting
Imatest IT-C instructions - Running Imatest IT (Industrial Testing)-C
Introduction - Installation - Step 1: Capture Images - Step 2: Configure INI File - Step 3: Call Imatest IT Modules - Step 4: Process Results - Error Handling - Sample Code - Advanced Topics - Troubleshooting
Imatest IT-C++ instructions - Running Imatest IT (Industrial Testing)-C++
Introduction - Installation - Step 1: Capture Images - Step 2: Configure INI File - Step 3: Call Imatest IT Modules - Step 4: Process Results - Error Handling - Sample Code - Advanced Topics - Troubleshooting
Imatest IT-Python instructions - Running Imatest IT (Industrial Testing)-Python
Introduction - Installation - Step 1: Capture Images - Step 2: Configure INI File - Step 3: Call Imatest IT Modules - Step 4: Process Results - Error Handling - Sample Code - Advanced Topics - Troubleshooting
Imatest IT-.NET (C#) instructions - Running Imatest IT (Industrial Testing)-.NET (C#)
Introduction - Installation - Step 1: Capture Images - Step 2: Configure INI File - Step 3: Call Imatest IT Modules - Step 4: Process Results - Error Handling - Sample Code - Advanced Topics - Troubleshooting
Imatest IT-.NET (Visual Basic) instructions - Running Imatest IT (Industrial Testing)-.NET (Visual Basic)
Introduction - Installation - Step 1: Capture Images - Step 2: Configure INI File - Step 3: Call Imatest IT Modules - Step 4: Process Results - Error Handling - Sample Code - Advanced Topics - Troubleshooting
Imatest IT Parallel (IT-P) - Accelerating Imatest IT by performing tests in parallel
Imatest INI file reference - Reference to INI files for IT/EXE and IT/DLL users (sections used in several modules)
INI file structure - INI File Monitor - [api] (for Imatest IT) - [dcraw/LibRaw] - [rdraw] (Generalized Read Raw) - Secondary Readouts - Miscellaneous
SFR INI file reference | SFRplus INI file reference | eSFR ISO INI file reference | SFRreg INI file reference | Checkerboard INI file reference
Direct Read Mode - Pass image data directly into Imatest IT, without writing to a file on disk
Implementing Pass/Fail - Setting up Pass/Fail criteria and Pass/Fail Reference. For Imatest IT and GUI versions.
Pass/Fail Monitor - Realtime display and update of pass/fail results (useful with Imatest IT)
Operator Console - User interface for production environments
Imatest IT Knowledge Base - Articles about Imatest IT

Appendix

FAQ - Frequently Asked Questions
Cross-reference tables - Tables to help you navigate Imatest
Suppliers - Image quality factors - Modules - Test charts - Test images
Version comparison: Studio vs. Master - Which is right for you?
Troubleshooting - What to do when Imatest doesn't work
Installation problems - Problems after install - Missing DLLs - Runtime problems - Corrupted INI file - Command (DOS) window - A module has stopped working - Diagnostics runs - Path conflicts
Imatest Change Log - Imatest release history
Default INI Folder - Location on your computer of resource files used by Imatest
INI file reference
License - The Imatest End User License Agreement (EULA)
Glosario en Espanol

Index of the Table of Contents
Image quality — Sharpness — Other IQ factors — IQ Utilities —  Getting started — Imatest Instructions – general — 

Troubleshooting —  Knowledge Base highlights — Slanted-Edge sharpness modules — Other sharpness modules —
Tone, Color, Noise & Dynamic Range modules — Spatial & Uniformity modules —
Miscellaneous modules and utilities
— Industrial Testing edition — Appendix